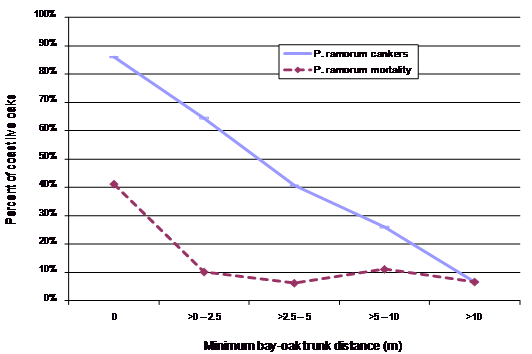
SOD incidence, severity, and mortality rates increase as the distance from oak trunk to California bay foliage decreases (fig. 1-5) (Swiecki and Bernhardt 2007, 2008b). Oaks with California bay foliage directly over or within 1.5 m (5 ft) of the trunk have the highest risk of infection and mortality (fig. 1-5). Disease risk also increases as the total amount of California bay cover within 2.5 to 5 m (8 to 16 ft) of the oak trunk increases.
Proximity of California bay to oaks strongly influences disease risk because few P. ramorum spores are moved more than 5 m horizontally by rain splash. Spores in water drops splashing from leaves higher in the canopy are more influenced by wind, and may travel greater horizontal distances. Spores present on the soil surface and in low foliage (less than about 0.5 m above the ground) are only dispersed about 1 m by rain splash alone (Tjosvold and others 2006).

Figure 1-5—Relationship between minimum bay foliage-oak trunk distance and SOD incidence and mortality in coast live oak. Bay foliage-oak trunk distance is defined as the shortest distance between the main stem of an oak and a vertical line dropped from the nearest bay foliage (fig. 1-6). Data shown were collected in 2004 from coast live oaks in Marin and Napa Counties (Swiecki and Bernhardt 2007, 2008b). Note: 2.5 m = 8.2 ft.
Other factors may also influence the spore deposition on oaks from infected California bays (Swiecki and Bernhardt 2007, 2008b).

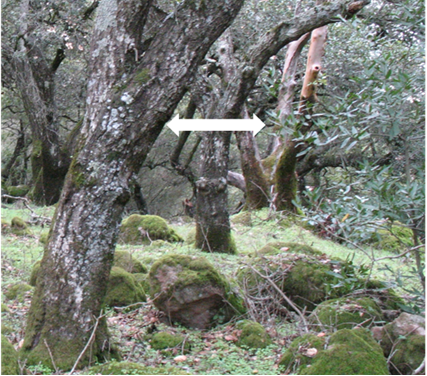
Figure 1-6—Example of minimum distance between California bay foliage and oak trunk (white arrow).