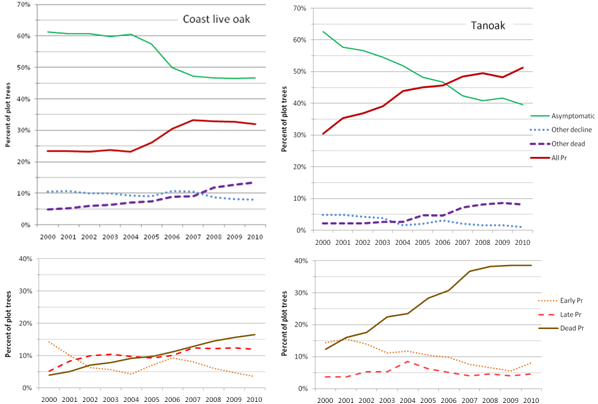
Since SOD has been introduced into forests, overall mortality rates have increased substantially. Since the introduction of SOD, average mortality rates among coast oaks due to SOD averaged 1.2% per year, compared to 0.8% per year due to causes other than SOD. Among tanoaks, mortality due to SOD averaged 2.6% per year, compared to 0.6% per year for nonSOD causes (fig. 1-16). Background rates of mortality are similar to those measured in forests without SOD (Swiecki and Bernhardt 2008c).
The trajectory of SOD incidence and mortality varies from stand to stand. At a given time, different stands or portions of a single stand can be at different stages in the disease epidemic based on:
Overall, SOD incidence and mortality tend to increase faster and reach higher levels in tanoak stands than in oak stands (fig. 1-16). In oak stands, disease is initially very patchy and is strongly associated with California bay. Even after SOD is well established, oak mortality is not likely to affect all trees in an area. SOD incidence in oak stands tends to increase in pulses over time (fig. 1-16), increasing following years in which late spring rains favor disease development. Few or no new SOD symptoms may be seen in dry years.
If conditions for SOD development are favorable, many of the most highly susceptible trees in a stand may be infected and killed within the first few years after P. ramorum becomes established in an area. Subsequent pulses of disease may be less dramatic because fewer highly susceptible trees are left.
Some trees that remain healthy after the initial and subsequent waves of disease may have escaped disease due to chance. These susceptible trees can become infected later if exposed to enough inoculum during a year in which conditions are favorable for disease development. Hence, various disease management actions may be justified even in stands that have already experienced substantial disease.

Figure 1-16—Changes in disease status of coast live oak and tanoak from September 2000 through September 2010 in 150 permanent plots in Marin, Sonoma and Napa Counties. Dead Pr = tree dead as a result of Phytophthora ramorum; Late Pr = live trees with P. ramorum cankers plus beetle boring and /or Annulohypoxylon thouarsianum fruiting bodies; Early Pr = live trees with P. ramorum cankers only; Non Pr dead = tree dead due to agents other than P. ramorum; Non Pr decline=tree in severe decline due to agents other than P. ramorum; Asymptomatic= no evident symptoms of P. ramorum infection or decline due to other agents.