General sampling considerations for testing nursery plants for root-rotting Phytophthora species are discussed in Sections 2.1, 2.2, and 2.3. On this page we discuss specific sampling considerations when using the bench leachate test method.
The bench leachate test is a batch test that involves testing irrigation leachate collected from an array of container plants. Phytophthora detections have been made in tests using this method from arrays numbering from 1 (testing single plants, various sizes) up to 200 plants (D25L containers, 410 ml nominal volume). For the bench leachate test, it becomes impractical to increase the number of containers per test beyond a given point because of the amount of time required to irrigate the test array. For example, under the current protocols, each irrigation of a #1 (1 gal) or TP414 container requires 500 ml. At a somewhat high flow rate of 100 ml/sec (only viable with adequate head space in the container) each container would require 5 seconds of irrigation. Irrigating 200 plants in this way would require 16.7 minutes, longer than the test protocol’s 15-minute interval between successive irrigations. Hence, if we consider just the amount of time required to conduct tests, it is clear that we can test more plant batches in a given amount of time if fewer plants are included in each test.
Beyond this, the likelihood of detecting Phytophthora in a batch of plants can vary with the size of the test array and the infection rate. In the bench leachate test, as in other test methods, detection efficiency varies with the density of the pathogen in the sample. Detection is generally more likely if the inoculum density in the sample is high and decreases to nearly zero if inoculum density is very low. By definition, the detection rate will be zero beyond the actual detection limit of the test method.
The bench leachate test does not actually quantify inoculum in the tested array of plants. It provides a binary (yes/no) result indicating whether detectable amounts of inoculum are present. A positive result from this test indicates that Phytophthora is present in one or more plants in the tested array, and by extension, that the sampled batch of plants is infested at some level. A negative result (no detection) indicates that either Phytophthora was absent in the test array or, if present, inoculum levels were below the detection limit in that test.
For the bench leachate test, the detection limit and detection efficiency are directly related the amount of inoculum in the zoospore collection vessel (ZCV). The inoculum level in the ZCV is affected by the proportion of plants in the test array that are infected and the amount of zoospore production by the individual infected plants in the test array. In normal nursery tests, these are unknowns.
In most nurseries adhering to the Phytophthora BMPs, the primary use of the bench leachate test is for quality control testing: checking to see if a batch of plants has become accidentally infected. The test is also used for predelivery quality control testing by a client to verify that plants are free of detectable Phytophthora. For these uses, it is important to optimize the sampling of plant batches to obtain the highest possible detection efficiency, i.e., detect Phytophthora if it is present. Ideally, we want to reliably detect Phytophthora if it is present in a small percentage of the plants in a batch (on the order of 1% or less) so that corrective action can be taken as quickly as possible before greater spread of the pathogen occurs. To interpret negative (no detection) test results, we need to know how much contamination could be present in a batch of plants without being detected by one or more tests.
To help address the issues noted above, we have conducted a number of controlled studies on arrays that have known numbers of infected plants. These studies have provided data on the Phytophthora detection rate at various low infection rates in the tested arrays. We then applied statistical modeling methods to investigate how different components of the sampling process, including batch size, sample size, infection rate, and intentional sampling bias, affect detection efficiency.
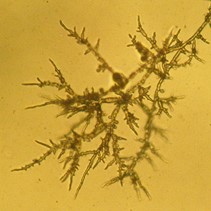
In our controlled experiments, we varied the test array infection rate (TAIR) by placing one (or occasionally more) Phytophthora-infected plants into test arrays of noninfected containers (seed-propagated turf grass grown in heat-treated soil). In conducting these tests, we found that the amount of inoculum produced by a given plant varied from test to test. However, it is not possible to directly assay how much inoculum an individual infected plant will produce on a given day and use the same plant as an inoculum source in a multiplant array at the same time. This variability contributes to uncertainty in our estimates of detection efficiency.
Note that the lowest nonzero TAIR possible in an array of 20 plants is 5% (1 in 20), compared with 1% in an array of 100 plants (1 in 100). As the array size increases, TAIR values decrease for a given number of infected plants in the test array. Figure 1 shows the possible TAIR values for test arrays with 20, 40, and 100 plants.
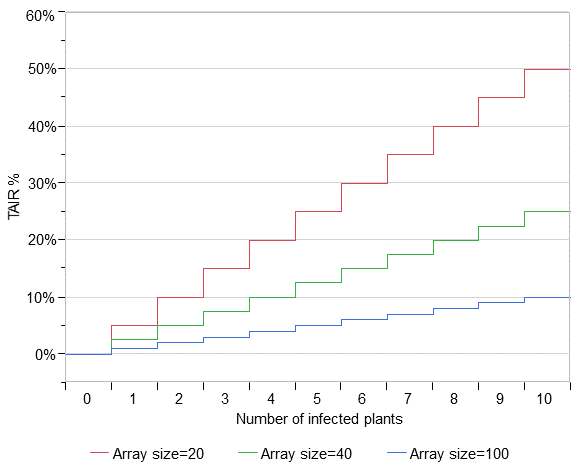
Figure 1. Test array infection rates (TAIR) for different test array sizes (20, 40, 100) with specific numbers of infected plants in the array.
Almost all of our controlled tests to date (63 of 65) were conducted on arrays with TAIR between 2.4 and 33.3%. The probability of detection at higher TAIR was calculated from the experimental detection rate for single plant tests. Data from these controlled tests were used to develop an estimated detection efficiency function (Figure 2). To develop this function, we assumed that the detection efficiency function takes the form of a logistic curve. The lower bound of the curve is set at 0 for 2% TAIR, i.e., the function indicates that Phytophthora will not be detected if the TAIR is 2% or less. This is a conservative estimate but we have not yet conducted enough tests with test array sizes over 42 plants to establish the lower detection limit for the bench leachate method. The upper bound of the function (Figure 2) indicates that Phytophthora will be detected more than 99% of the time when all plants in a multiplant (at least 20) test array are infected (100% TAIR).
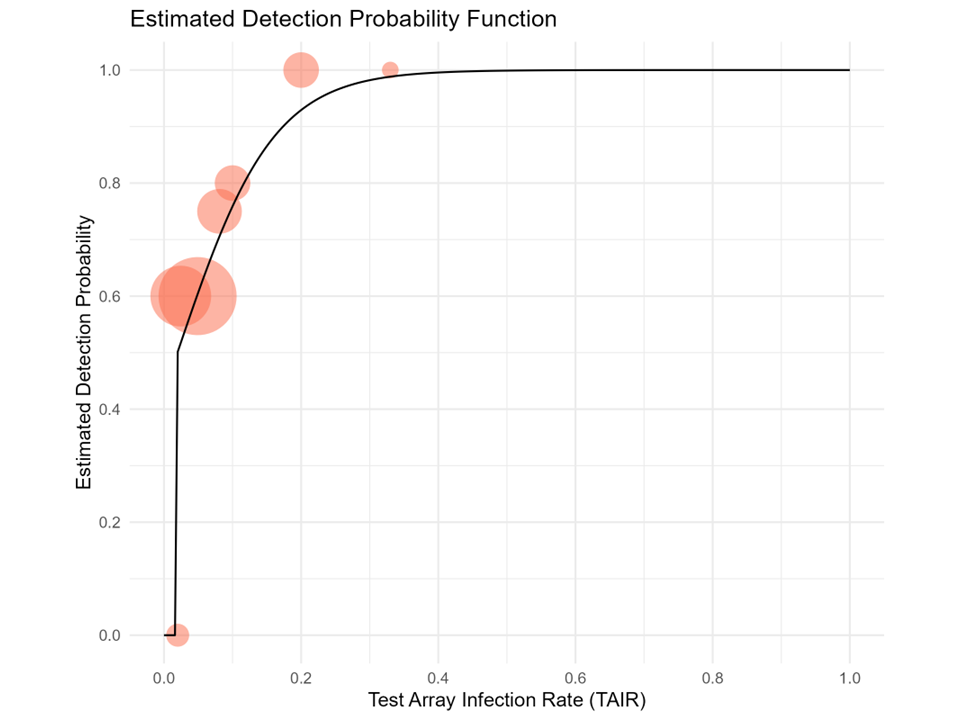
Figure 2. Estimated detection probability as a function of test array infection rate (TAIR) (black curve) based on data from controlled tests with known TAIR values. Red circles depict results from the experiments (percent of successful detections for a given TAIR) with circles centered on the detection mean and the size of the circle proportional to the number of tests.
We developed two types of statistical models to investigate the effects of several variables on the probability that Phytophthora would be detected in one or more tests (detection probability). The variables were:
For all models, we assume that sampling occurs without replacement (no plant will be tested twice). For unbiased (random) sampling, the simulation assumes an underlying hypergeometric distribution for the plants in the test arrays. The hypergeometric distribution is the classic probability distribution for sampling units with binary outcomes (e.g., there are x red marbles and y blue marbles in a bag and you draw z marbles without looking). In nursery testing, the sampler can either select an infected plant or a noninfected plant, and the likelihood of selecting one or the other is directly related to their prevalence in the population, i.e., the batch infection rate in our models. For biased sampling, Wallenius' noncentral hypergeometric distribution was used. This is an extension of the hypergeometric distribution that includes an odds ratio parameter controlling the relative "weights" of the sampled units (plants). The weights are used to model intentional bias towards sampling infected plants.
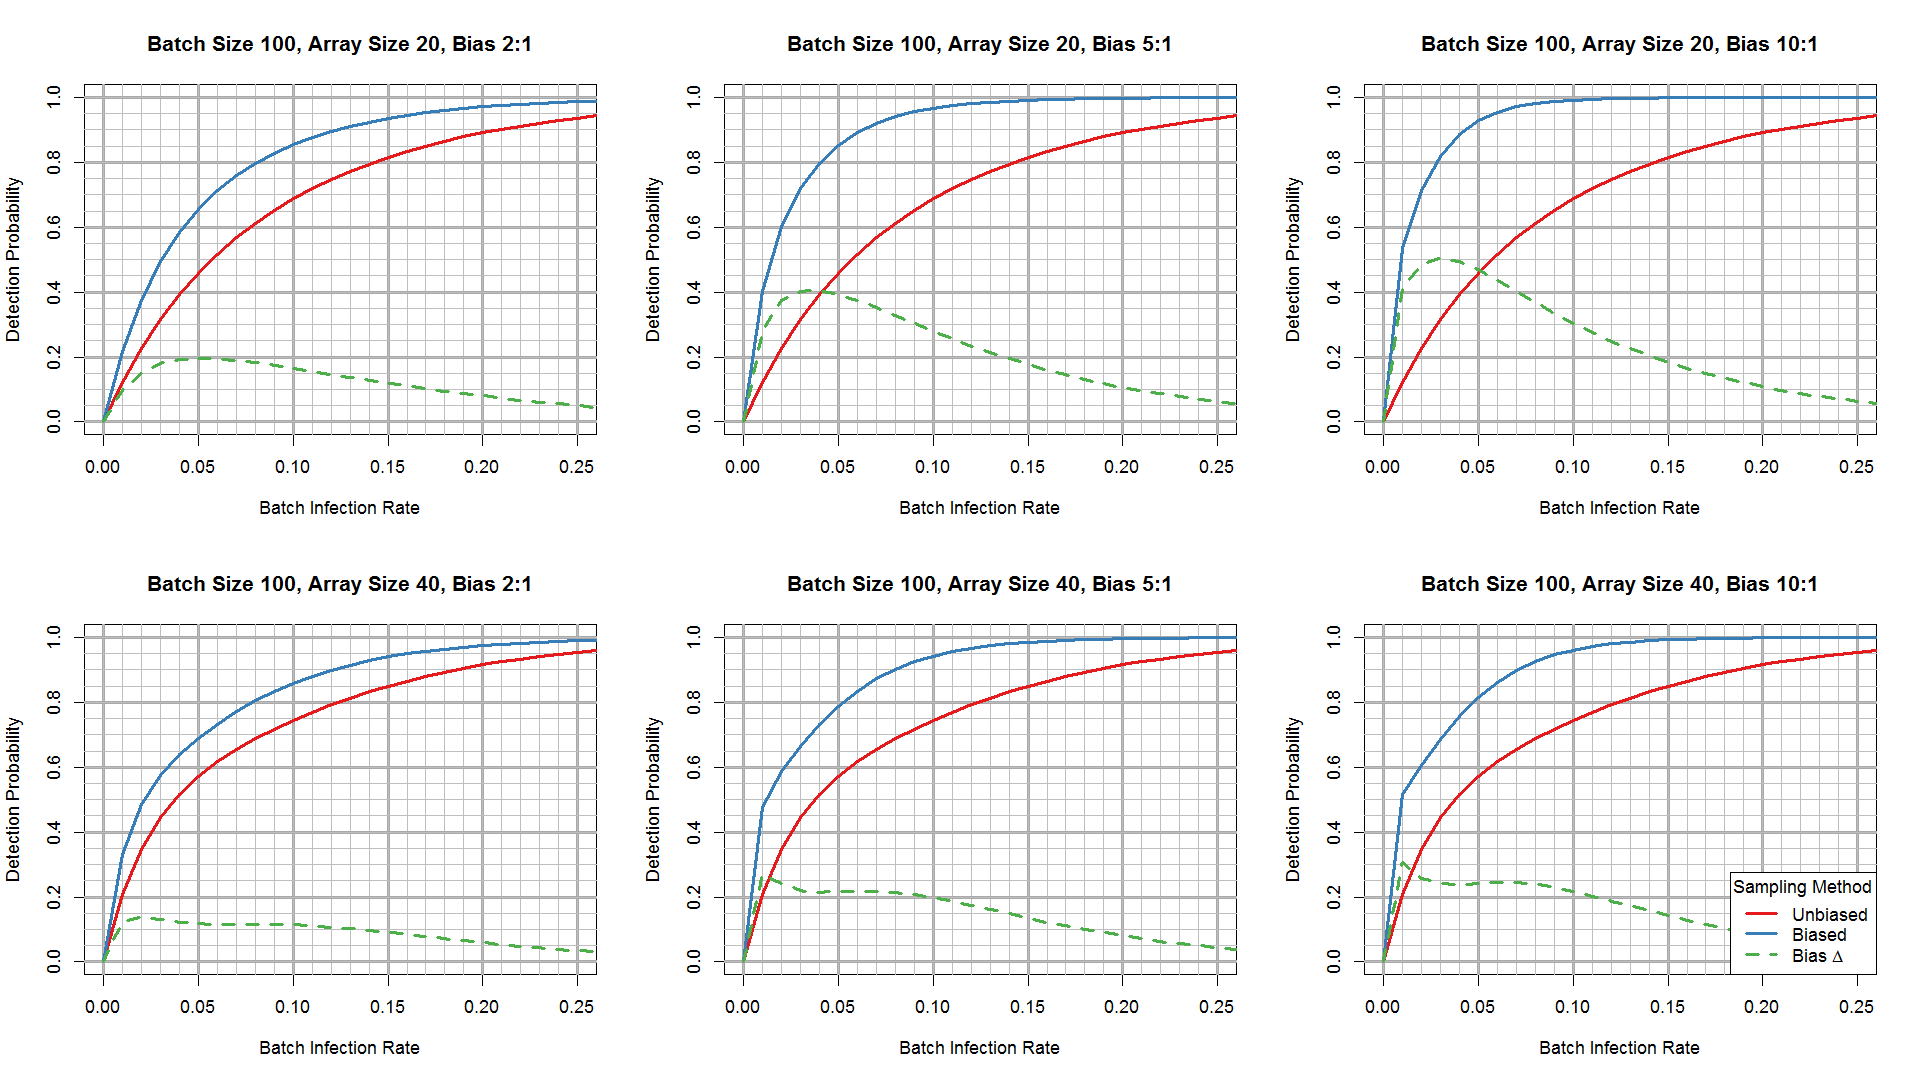
The first set of plots (figure 3 below) is based on probability equations. They show the detection probability of a single test for given combinations of batch size, array size, and bias ratio across a range of batch infection rates (0 to 25%). A finite number of possible array sampling outcomes exists for a given batch size, array size, and batch infection rate. For instance, if the array size is 20, any given array could contain from 0 to 20 infected plants, depending on batch size and TAIR. The probability of each of these outcomes was calculated using the appropriate hypergeometric probability function and multiplied by the probability of detection at the appropriate TAIR obtained from the estimated detection probability function shown in Figure 1. These products were then summed to yield the detection probability for a given set of inputs.
Outputs from this model for different array sizes, batch sizes, and batch infection rates are shown in Figure 3. By comparing the red (unbiased sampling) and blue (biased sampling) lines, or the differences between these lines shown by the dashed green line, it is clear that using sampling bias to preferentially select infected plants for testing greatly improves detection efficiency, especially at low batch infection rates. The advantage of biased sampling increases as the bias ratio increases, as expected.
The effect of test array size differs between unbiased (random) and biased samples. For unbiased samples, especially at low infection rates, the larger test array (40) was somewhat more efficient that the smaller array (20). If we sample at random, the larger sample is more likely to contain at least 1 infected plant. However, samples larger than about 40 (e.g., 100) are not more effective because of the effect shown in Figures 1 and 2. A single infected plant in an array of 100 (TAIR=1%) will not be detected because it is below the estimated 2% detection threshold. In contrast, a single infected plant in an array of 40 plants (2.5% TAIR) or 20 plants (5% TAIR) can be detected, though not in every test.
If we include sampling bias, the smaller test array is more likely to result in a detection if the overall batch size is small (100), but as batch size increases to 500 or above, the larger arrays show a slightly higher detection probability for a given batch infection rate. This effect is based on the total number of infected plants that can be sampled from the batch. In small batches with low infection rates, there are few infected plants to be selected. Once all of these have been selected (by biased sampling), any additional plants selected to fill out the array simply reduce TAIR and detection probability. Larger batches with low infection rates have more infected plants that can be selected. With effective sample bias, a larger array can include a few more infected plants, generating more sample combinations that have good detection probabilities. Other than through this interaction with test array size, batch size itself has little effect on detection probability.
Use buttons to select batch size
Figure 3. Phytophthora detection probability as a function of batch infection rate for unbiased (random) sampling (red lines) versus biased sampling (blue lines), at test array sizes of 20 (top row) and 40 (bottom row) and 3 batch sizes (buttons). Dashed green lines plot differences in detection probability between biased and unbiased sampling.
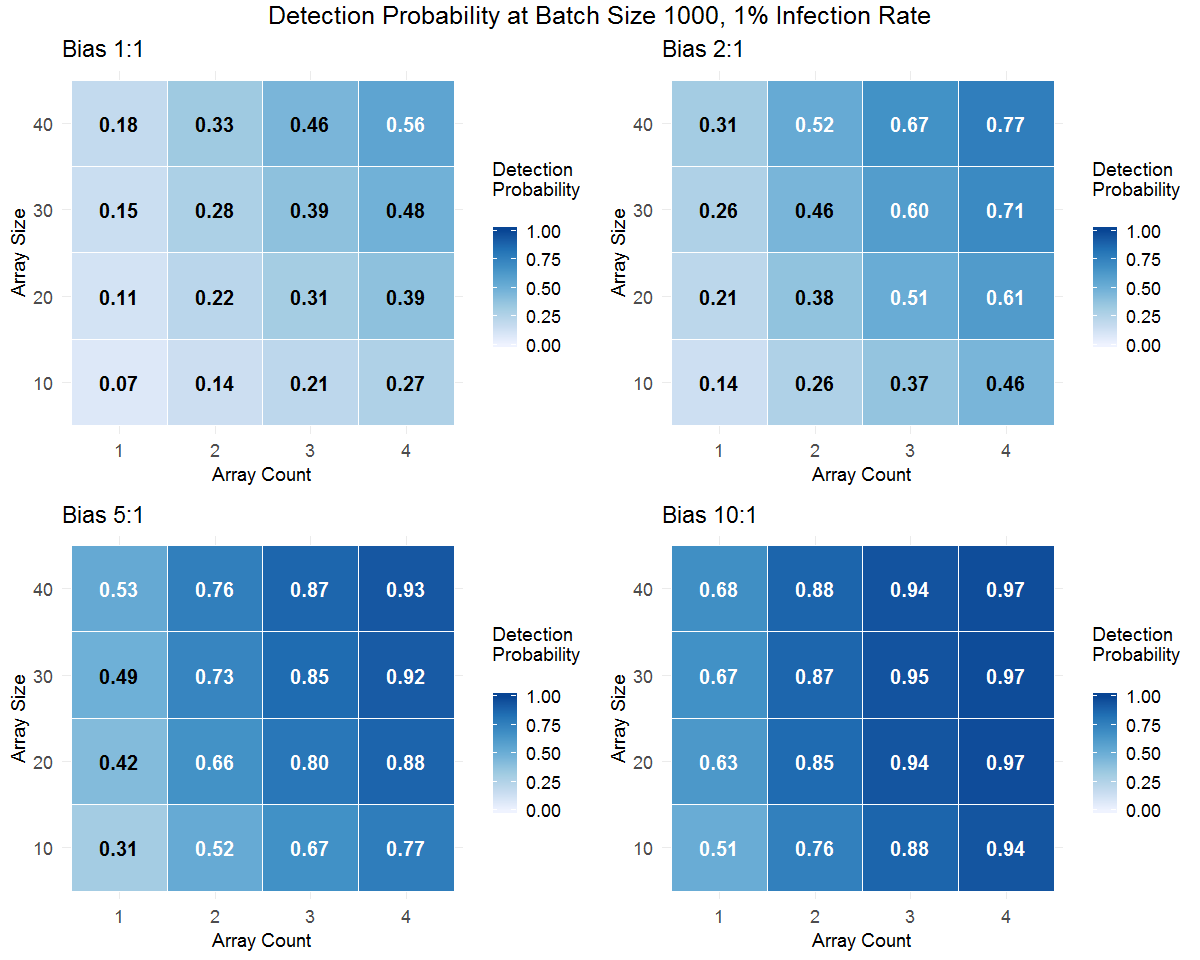
To investigate the added effect of running multiple tests (array count >1) on a batch of plants, we ran Monte Carlo simulations using sampling without replacement at various bias levels (1:1 [unbiased], 2:1, 5:1, 10:1). The simulations were run for batch sizes of 200 and 1000 with batch infection rates of 1-5%. Each simulation has two stages. In the first stage, the test array(s) are populated with infected and uninfected plants using unbiased or biased sampling. The simulation selects plants for the test arrays randomly from the appropriate hypergeometric distribution discussed above (the hypergeometric distribution varies depending on the bias level being tested) and distributes them across the number of arrays in the test. In the second stage, the simulation assumes that test array detection follows a binomial distribution with success probability determined by the detection probability function (Figure 1). For each test array, the detection outcome is randomly generated according to the appropriate binomial distribution. For a set of multiple test arrays, a detection is considered to occur if a detection occurs in at least one test array of the set. For each set of inputs, 1,000,000 arrays or sets of arrays and their corresponding detection outcomes were simulated to minimize Monte Carlo error.
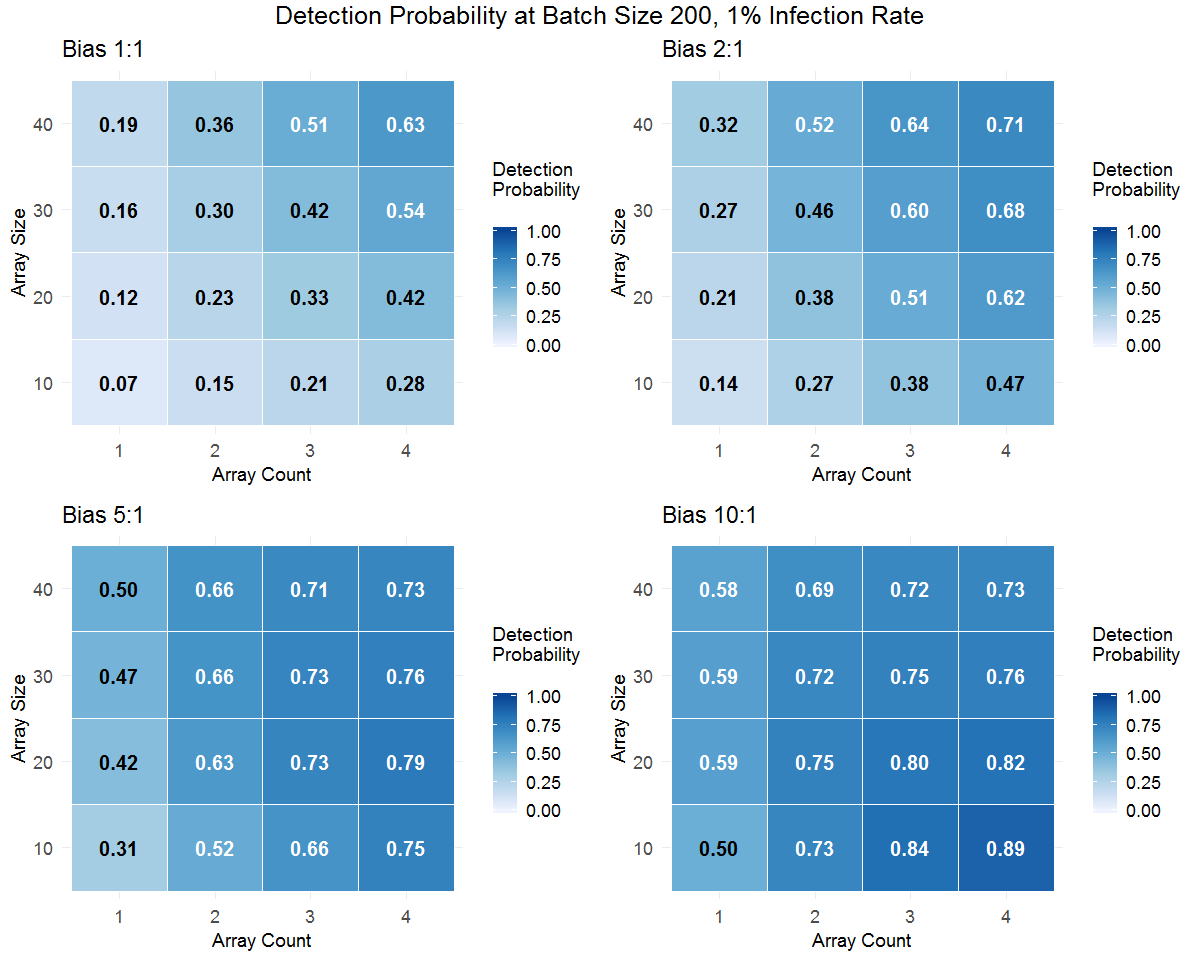
Results of these Monte Carlo simulations are shown in Figures 4 (batch size 1000) and 5 (batch size 200).
Use buttons to select batch infection rate
Figure 4. Phytophthora detection probabilities generated from Monte Carlo simulations for batches of 1000 plants (containers) using different test array sizes and 1 to 4 test arrays. Four sampling bias levels (1:1=unbiased/random sampling) are shown for each batch infection rate. Use the buttons to toggle between batch infection rates. Darker coloring of the cells in the tables indicates higher detection probability.
Use buttons to select batch infection rate
Figure 5. Phytophthora detection probabilities generated from Monte Carlo simulations for batches of 200 plants (containers) using different test array sizes and 1 to 4 test arrays. Four sampling bias levels (1:1=unbiased/random sampling) are shown for each batch infection rate. Use the buttons to toggle between batch infection rates. Darker coloring of the cells in the tables indicates higher detection probability.
Both large and small batch size simulations clearly show detection probability increases with increasing batch infection level and with increased sampling bias. Also, within the range from 10 to 40 plants per test (array size), detection efficiency increases with array size. Beyond this, the effects of array size show an interaction with batch size, array count (number of tests per batch), and sampling bias. The simpler situation is seen with large-batch (1000) simulations (Figure 4). For large batches, detection probability increases with the number of tests per batch (array count), but array counts of 2 or 3 provide a greater “bang for the buck” than 4, especially at higher bias ratios. This suggests that even for large batches of plants, detection efficiency does not improve much beyond about 3 tests if positive sample biasing is effective.
In both large-batch and small batch simulations, the bias ratio interacts with array size and array count to affect detection probability. For a given number of plants, multiple tests in smaller arrays outperform a single test of one array. For example, the detection probability for 2 tests of 20-plant arrays is greater than that of a single 40-plant array. This result is related to greater TAIR levels (Figure 2) and corresponding greater detection probability (Figure 1) in small arrays that contain one to a few infected plants. As TAIR and the bias ratio increase, this difference between single and split tests becomes smaller.
Small-batch simulations (Figure 5) show a further interaction of these factors. When the batch size is small, batch infection rate is low and sampling bias is high, "oversampling" can occur. In a batch of 200 plants with a batch infection rate of 2%, there are only 4 infected plants. If the sampling method is highly biased toward selecting the infected plants, array sizes that are too large are disadvantageous. Although most or all of the infected plants will likely be included in the sample, a larger test array will have a higher number of noninfected plants resulting in a lower TAIR that reduces detection probability. A smaller test will still be likely to capture most or all of the infected plants due to the high sampling bias but will have fewer noninfected plants, resulting in higher TAIR and greater detection probability.
The practical implication of the "oversampling" issue is that if a batch has a relatively small number of apparently symptomatic plants or other high risk plants of interest (e.g., a set of plants that were exposed to a potential contamination event), it is better to test these plants separately even if there are fewer than the planned number for the test. To optimize detection likelihood in this situation, test this highly biased sample and, if time and resources permit, test one or two more biased samples from the remainder of the batch. This approach maximizes the detection probability for the highly-biased sample. However, the additional test array(s) can provide further and potentially different information. For example, no Phytophthora might be detected in the highly-biased sample if the symptoms were related to uneven irrigation or other issues. By testing at least one other biased test array from the batch, you reduce the chance that you have been decoyed by the most conspicuous plants and missed sampling plants with more subtle symptoms that could be due to Phytophthora.
Some factors that may influence detection efficiency are not included in the models and simulations discussed above. The effect of these factors may be to either increase or decrease detection probabilities under some scenarios, but they are not likely to change the main effects evident in the models.
Depending on the source of Phytophthora contamination and when it was introduced into the batch, quite different spatial distributions of infected plants may develop within a batch. However, at low infection rates, infected plants are likely to show strong spatial clustering on nursery benches. This results from relatively rapid short-distance spread of the pathogen from container to container, mainly due to water splash. Experiments we have conducted to date indicate that overhead irrigation or rainfall is sufficient to quickly spread Phytophthora to adjacent closely spaced containers. In one study, P. cactorum spread from a single newly inoculated plant in a 4 x 5 array of SC7 containers to at least 4 other plants within 45 days, increasing the array’s infection rate from 5% to at least 25% over that period. In another study in a 5 x 5 array of AB35 (“Treeband”) containers, the array infection rate increased from 4% (one inoculated plant in the center) to at least 88% in less than 4 months. These studies suggest that due to local spread, infected plants will mostly be clustered within batches within a few weeks after a spot contamination event occurs. If infected plants tend to be spatially clustered, biased sampling should provide a much greater improvement in detection efficiency over spatially random sampling, especially at low infection rates in large batches. Because of spatial clustering, plants close to apparently symptomatic plants should be considered to have an elevated risk of infection even if symptoms are not evident.
Another factor that may influence detection probability is the delineation of a plant batch. By definition, a batch is a group of plants with a common risk profile with respect to potential for contamination in the propagation process. Many plant batches, especially relatively small ones, can be defined unambiguously. But as batch size increases and the plants occupy a greater area (e.g., on multiple benches), the batch may become less uniform with respect to potential for contamination. In such situations, dividing a nominal batch into two or more smaller batches for testing purposes can increase detection probability somewhat, especially at low infection rates and low sampling bias (e.g., when plants do not show obvious symptoms). If infected plants are spatially grouped in only one of the resulting smaller batches, the batch infection rate will be effectively increased, which increases detection probability.
Table 1. Factors that influence detection efficiency in the bench leachate test.
| Factor | Quantity/value known | Tester can influence |
|---|---|---|
| Array size | Yes | Yes |
| array count | Yes | Yes |
| Batch size | Yes | In part, by definition of batch for testing purposes. |
| Sample bias | No | Yes |
| Test array infection rate (TAIR) | No | Yes, through sampling bias and array size. |
| Batch infection rate | No | No, except in some cases where batch size is modified for testing |
| Detection threshold | Only approximately | No, except by deviating from test protocols to the extent that detection efficiency is reduced. |
Note that the specific procedures and parameters presented in the bench leachate protocol page have been designed to maximize the detection potential of the test. Deviations from the protocols can lead to reduced detection efficiency by altering the shape or position of the detection probability function in Figure 1. Such deviations would reduce detection probability below levels shown in Figures 3-5 above.
Overall, the output from the models and simulations discussed here have reinforced the main sampling recommendations we have made since 2017. Some of the recommendations, shown in Table 2, have been refined further based on the models discussed here.
Table 2. Recommendations to maximize Phytophthora detection probability for the bench leachate test.
| Factor | Target | Notes |
|---|---|---|
| Array size | 20-40 |
|
| Array count | 1-4+ |
|
| Batch size |
| |
| Sample bias | high as possible | Use positive sample bias to include plants that are more likely to be infected based on:
|