As discussed under Photogrammetry and remote sensing, tree canopy cover can be assessed from aerial photos using a variety of methods. Some of the methods are simple, while others are relatively sophisticated. Both the time required to make the assessment and the accuracy of the assessment can be influenced by the method used. On this page, we compare two methods for assessing canopy cover: a scan of a black and white 1:6000 aerial photo obtained from a commercial vendor.
Image analysis method. One technique that can be used to measure tree canopy cover with image analysis software involves converting a grayscale or color image into a black and white image that consists only of canopy (black) and 'not canopy' (white). This type of conversion can be accomplished using image analysis software alone or in conjunction with standard graphics software. For image analysis, we used ImageTool software (ver. 2 alpha) for Windows, which was developed at the Department of Dental Diagnostic Science at The University of Texas Health Science Center, San Antonio, Texas. Similar software is available from the National Institue of Health http://imagej.nih.gov/ij. We also used Adobe Photoshop graphics software to make certain image manipulations. The steps we used to calculate tree canopy using this image analysis technique are described and illustrated below.
Digital dot grid method. Dot grid counts of canopy can be performed on digital images by creating a computer graphic grid, superimposing it over the image, and manually counting the number of dots that occur over tree canopy. We used Lotus Freelance Graphics software to create and superimpose the dot grid, although other general graphics software could be used similarly.
Step 1. Image acquisition. For both methods, we needed a digital
image. In general, a relatively high resolution scan is preferable. The
example was scanned from a black and white aerial photo (1:6000) at 1200
dpi, 256 shades of gray. The scanned image was then cropped to include only
the area of interest. For this example, the subject area is a rectangular
parcel covering about 108 acres.

Step 2. Increase contrast and clean image. Using tools available in the graphics software (Photoshop), we cleaned the image manually to remove materials other than tree canopy, including the shadows cast by the canopies. This involves the iterative use of contrast-enhancing tools, erasing tools, and the "magic wand" tool that allows for the selection of contiguous areas of a given color value. The image shown is the result of these edits.
After this step was completed, we used the "posterize" function to reduce the total number of gray levels to 10 before some final cleanup of the image. The posterized image is not shown.
Step 3. Threshold image. Thresholding a monochrome image involves picking an intensity value above which all pixels will be converted to black and below which all pixels will be converted to white. Because virtually all non-canopy areas have already been converted to white pixels in the previous step, thresholding only involves converting the remaining gray tones to black pixels. If the contrast between tree canopy and the background had been greater in the original image, thresholding alone could have produced a fair approximation of canopy cover.
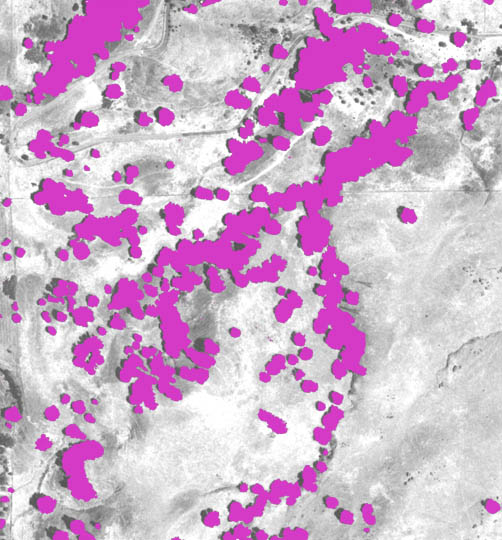
Step 4. Recheck and edit thresholded image. To improve the accuracy
of the thresholded image, we converted the thresholded image to a color
(RGB) version, eliminated the white pixels using the magic wand tool and
used Photoshop's layering functions to superimpose the thresholded image
over the original photo image. This allowed us to adjust the thresholded
image to more closely approximate actual canopy cover. We erased thresholded
canopy from areas it did not belong and added additional canopy as needed
(using drawing tools) to fill in areas of canopy that had been eroded in
previous steps.
Step 5. Calculate % canopy cover. The color canopy image
layer needed to be reconverted to grayscale and re-thresholded in ImageTool
before the program would calculate the number of black and white pixels.
Although the final image included some stray black pixels that were not
tree canopy, there were not enough to affect substantially the accuracy
of the canopy estimate. Since ImageTool directly counts black and white
pixels, this determination is not a source of error. Rather, the degree
to which the thresholded image coincides with canopy cover determines the
accuracy of the canopy cover estimate.
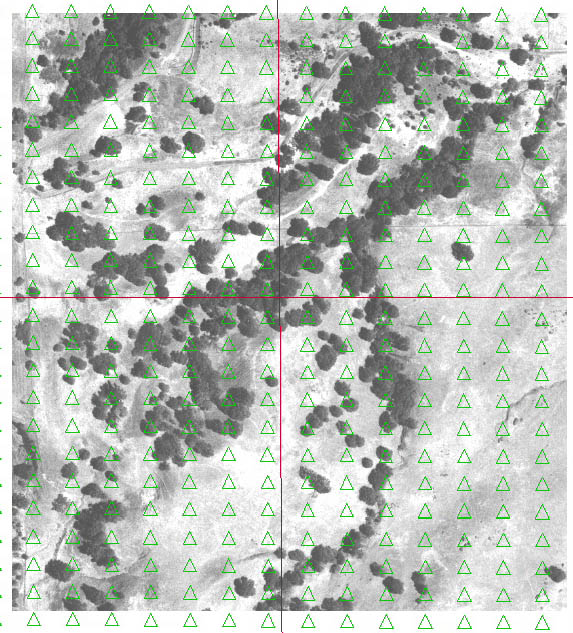
Using a digital dot grid. The image to the right shows how a digital dot grid overlay can be used to calculate canopy cover. We used open triangles rather than dots in order to produce an easy to locate, precise dot that would not obscure the underlying image. The sample point or "dot" is one vertex of the triangle. A uniform dot grid can be produced by preselecting a given vertex (e.g., lower right) for all triangles. To increase the precision of the estimate, we made three dot counts, shifting the grid randomly before each replicate count. Each count included 294 dots, so the total sample size was 882 dots. We zoomed in on the image as needed during the counts to make more accurate distinctions between canopy and shadow; the red lines were used to help keep track of our position on the grid when the image was magnified.
Results. Using the image analysis method described above, the ImageTool software calculated that canopy covered 20.78% of the final edited image in Step 5. By comparison, using dot counts of the thresholded image shown in Step 6 we estimated canopy cover at 21.4% (a difference of 0.6%). Dot counts on the original aerial scan resulted in a estimate of 20.97% canopy cover. Processing the scanned photo for image analysis required about 4 hours more time than was required for estimating canopy cover using dot counts on the original scanned image, although the extra time required would vary with the characteristics of the image and the editing tools being used. Although it clearly required more time than dot counting, the image analysis method produced an image of tree canopy cover that could be overlaid on earlier or later aerial images (e.g., using GIS or graphics software) to directly show where changes in canopy cover have occurred. This may be especially useful for determining where trees have been removed. Note that accurate interpretation of canopy by the human analyst is required to obtain accurate results using either method.