Construction and performance of solar ovens used for heat treatment of soil to eliminate Phytophthora
Version 3/24/2021
Support for construction and testing of this equipment was provided by Valley Water (Santa Clara Valley Water District, San Jose, CA). Special thanks to Confluence Restoration employees Kevin Leopold, Ryan Yarbrough, and Doug Sommerville who excavated sites, loaded and unloaded solar ovens, and downloaded temperature logger data. We thank Janell Hillman for moving the light sensors between the planting sites and downloading the light sensor data. We also thank Janell for her support of this project.
Heat treatment is the most consistent and effective way to eliminate Phytophthora from soil or potting media. Depending on the temperatures used, heat treatment can also eliminate other plant pathogens, nematodes, insects, and weed seeds. Soil or media can be heated to appropriate temperatures using devices that are heated by fuel (e.g., propane), electricity, or solar energy. Heating via direct solar energy in solar ovens is a low cost and highly effective option for sites where unobstructed sunlight is available for at least 5 hours during peak solar radiation (at least 2.5 hours before and after solar noon).
Related pages - Using heat to eradicate soil-borne plant pathogens from nursery potting media ("soil sterilization"), Phytosanitary Procedures for BMPs for Producing Clean Nursery Stock sections 1.2. Heat treatments and 2.4. Heat treatment of potting media
The simple solar oven discussed here was specifically intended to heat soil to temperatures high enough to kill propagules of the plant pathogen Phytophthora in soil excavated from contaminated planting sites. Due to the remote location of the site and other site constraints (moderately windy) we designed and built the ovens of portable components that were transported to and assembled at the site. This document presents both construction details and performance data for these solar ovens.
1. SOLAR OVEN CONSTRUCTION
The solar ovens are relatively wide with short sides, reflective interiors, and tilted windows. This design minimizes the amount of internal shade generated by the oven side walls near midday. Solar ovens were designed for ease of transport, assembly, and disassembly in the field. They were designed to use a 2 by 4 foot single pane, aluminum-frame glass window slider as the oven top. The four vertical walls and floor of the oven were constructed as independent panels. They were made of 1-inch thick Johns Manville AP™ foil-faced foam sheathing (polyisocyanurate foam, R-6). Construction adhesive was used to glue aluminum flashing to the inside panel faces (over the foil-faced side of the foam sheathing) to provide a reflective interior in the oven (Figure 1 upper right). The plastic wall panels (PLAS-TEX PolyWall wall panels, 0.06 inch thick) were glued to the outside faces of the foam sheathing to protect the foam while minimizing weight. Galvanized steel J-channel was used to trim the edges of the foam panels, providing protection, structural strength, and rigidity (Figure 1). Additional galvanized steel right-angle flashing was mounted on edges of panels to help link the sides together (Figure 1 bottom right, Figure 2, Figure 3). Galvanized steel right-angle flashing was also attached to the aluminum window frame to help hold the window in place on the sloping top (Figure 3, lower right). Nylon ropes (Figure 5) were used to cinch the window to the oven in the field. Self-adhesive rubber or foam gasket material was used along all joints to seal the oven as tightly as possible.
A chrome-plated steel wire shelf (Style Selections 1.5 X 18 X 48 inch chrome-plated steel freestanding shelving unit, capacity 350 lbs.) was attached to the inside of the bottom panel to provided a surface to hold soil-filled buckets (Figure 2). The shelf surface was about 2 cm above the bottom panel to allow for air circulation under the buckets. Short sections of 0.5 inch EMT conduit were used to help provide support in the center of the shelf material to maintain the gap between the shelf and the bottom panel. Sections of 1 inch diameter EMT conduit were pressed into the corner rod openings in the wire shelf, and 0.75 inch diameter EMT conduit legs were inserted through these supporting sleeves. To lock the height of the sliding leg, a straight conduit screw coupling was cut in half and the internal ridge was ground off so the coupling would side along the 0.75 inch EMT. The coupling was placed against the 1 inch EMT corner sleeve and locked into place on the 0.75 inch EMT leg once it was placed at its desired height. This leg construction was used to allow the height of each leg to be set independently so the oven could be mounted level on sloping ground (Figure 4). The openings at the ends of the legs were sealed with a plastic cap on the outside end and with foam insulation and silicone caulk on the end inside the oven.
Soil to be heated in the ovens was placed in galvanized steel buckets with locking lids (Behrens 6-gallon galvanized steel trash can with lid) (Figure 4). The buckets were painted flat black on the outside to facilitate heating. A central open core was made for each bucket with a section of 3-inch diameter galvanized vent pipe cut to a height just below the rim of the bucket. This central opening was used to obtain more rapid and uniform heating of the soil mass by minimizing the distance to the center if the soil mass. Pieces of thermal anti-condensate 6-mil greenhouse film were used to cover each filled bucket after it was placed in the oven. The film was held in place over the bucket top with an elastic cord. This film prevented moisture loss from the soil in the bucket. It also kept condensation from forming on the inside of the window pane which would reduces the transmission of solar energy into the oven.
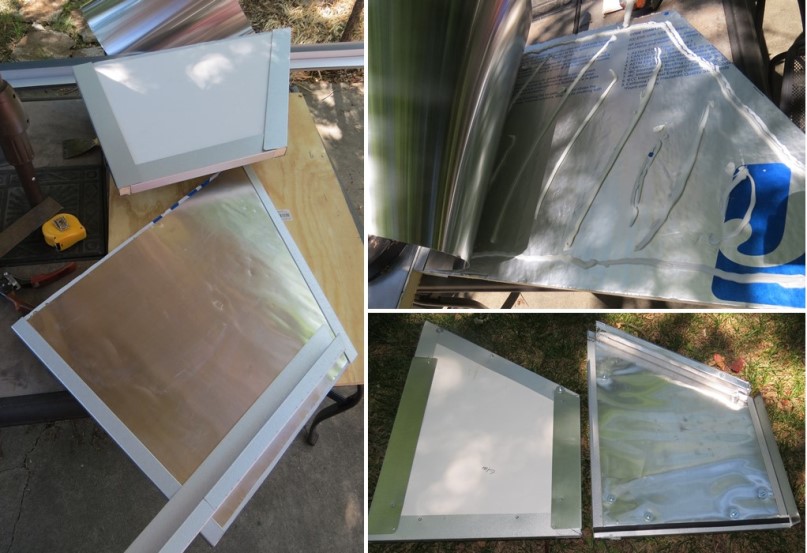 Figure 1. Construction details of solar oven side walls. Foam sheathing was surfaced with aluminum flashing to the inside (here being glued on with contruction adhesive), plastic wall panel to the outside. Edges were trimmed with J channel (left) to help hold the wall layers together. Additional angles were attached over the J channel to the vertical edges for attaching sides together (bottom right).
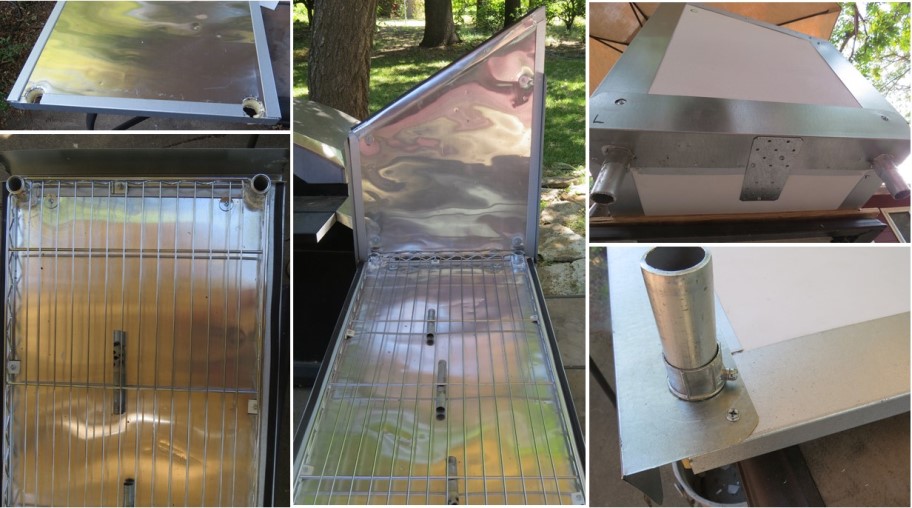 Figure 2. Construction details of solar oven bottom. A wire shelf unit was attached to the inside of the bottom oven panel with clips held on with machine screws that extended through the J-angle. Short sections of 0.5 inch EMT conduit provided support in the center of the shelf material; the edges are supported by the shelf edging. Short 1 inch diameter EMT conduit sleeves were pressed into the shelf corner support holes and extend below the shelf. Gaps around the legs were filled with silicone caulk and half of a 1-inch conduit screw coupling was used to help secure the bottom panel to each leg. As shown in Figure 4, EMT 0.75 inch conduit legs fit into these sleeves and are locked into place using a separate half 0.75 inch conduit screw coupling. Angled flashing on the two short ends of the bottom panel help support the side walls. A small metal plate (top right) provides additional support beneath the angle.
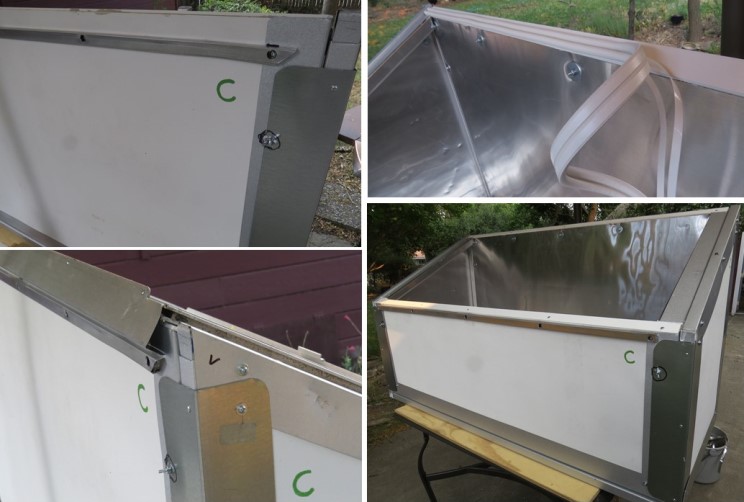 Figure 3. Construction details of solar oven long sides.
Strips of PVC molding (top and bottom left) were attached to the angled top surface of the walls, and aluminum strips (screen framing) were used to secure the upper edge of outer plastic facing of the long sides. Silicone rubber gasket material (upper right) was applied to all top edges to form a good seal with the window frame. Circled machine screws with wing nuts near the corners are the only screws (4 in total) that needed to be removed to dissemble the oven into its 5 panels. An angle attached to the window (bottom left) helps hold the window in place. An insulated J-channel bracket along the top of each short wall (bottom right) was necessary to a support the edges of the window and provide a surface where a weatherstripping could be applied (Figure 4, top right). The length of the oven was based on the shelf length, which was slightly longer than the window.
Figure 3. Construction details of solar oven long sides.
Strips of PVC molding (top and bottom left) were attached to the angled top surface of the walls, and aluminum strips (screen framing) were used to secure the upper edge of outer plastic facing of the long sides. Silicone rubber gasket material (upper right) was applied to all top edges to form a good seal with the window frame. Circled machine screws with wing nuts near the corners are the only screws (4 in total) that needed to be removed to dissemble the oven into its 5 panels. An angle attached to the window (bottom left) helps hold the window in place. An insulated J-channel bracket along the top of each short wall (bottom right) was necessary to a support the edges of the window and provide a surface where a weatherstripping could be applied (Figure 4, top right). The length of the oven was based on the shelf length, which was slightly longer than the window.
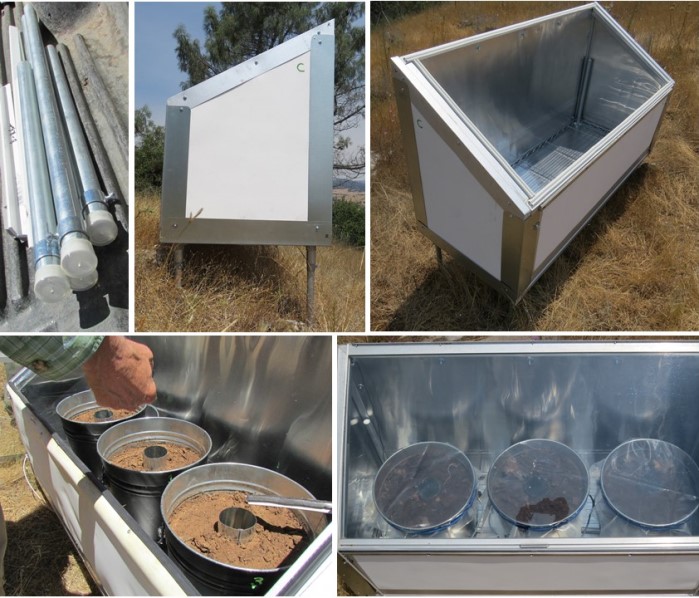 Figure 4. Final assembly of the solar oven in the field. Screw clamps on legs (upper left) are used to adjust leg length to level the unit on sloping or uneven ground. Legs extend into the interior of the oven (upper right). White gasket material is applied where the aluminum window frame contacts the oven (upper right). Three buckets painted black hold the soil excavated from an infested planting site (bottom). Thin-walled vent pipe sections in the center of each bucket minimize the effective distance between a wall and the center of the soil mass. Before heating, water was added to each bucket to wet the soil to near field capacity. Buckets were covered with greenhouse film the window was tied down to the oven with nylon ropes at each end (bottom right) to seal the window to the oven and prevent movement in high winds. The weight of the soil also helped stabilize the ovens.
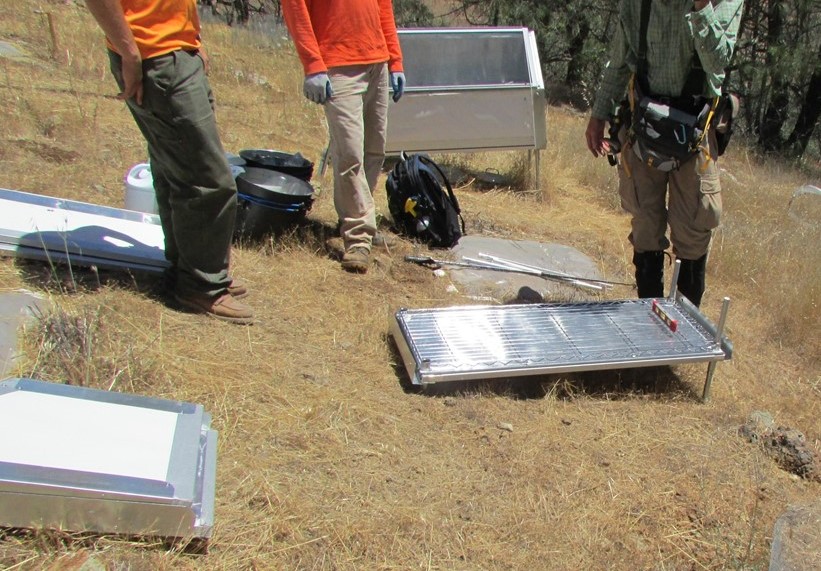 Figure 5. Assembly of the solar oven. Leveling the solar oven in the field.
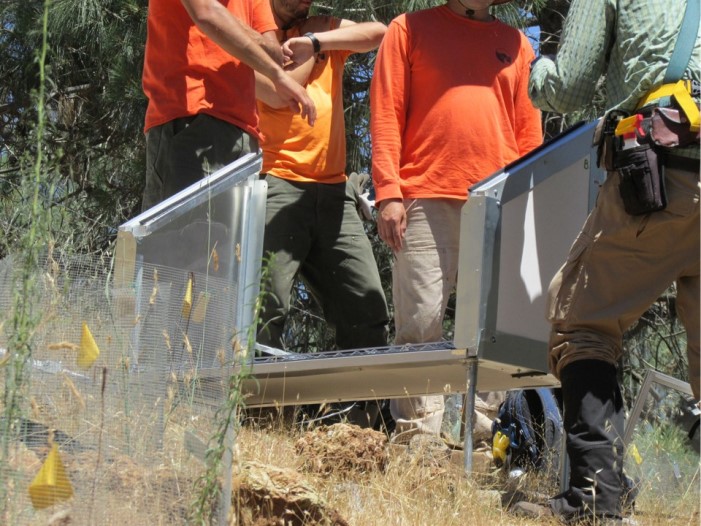 Figure 6. Assembly of the solar oven. Sliding sides in place.
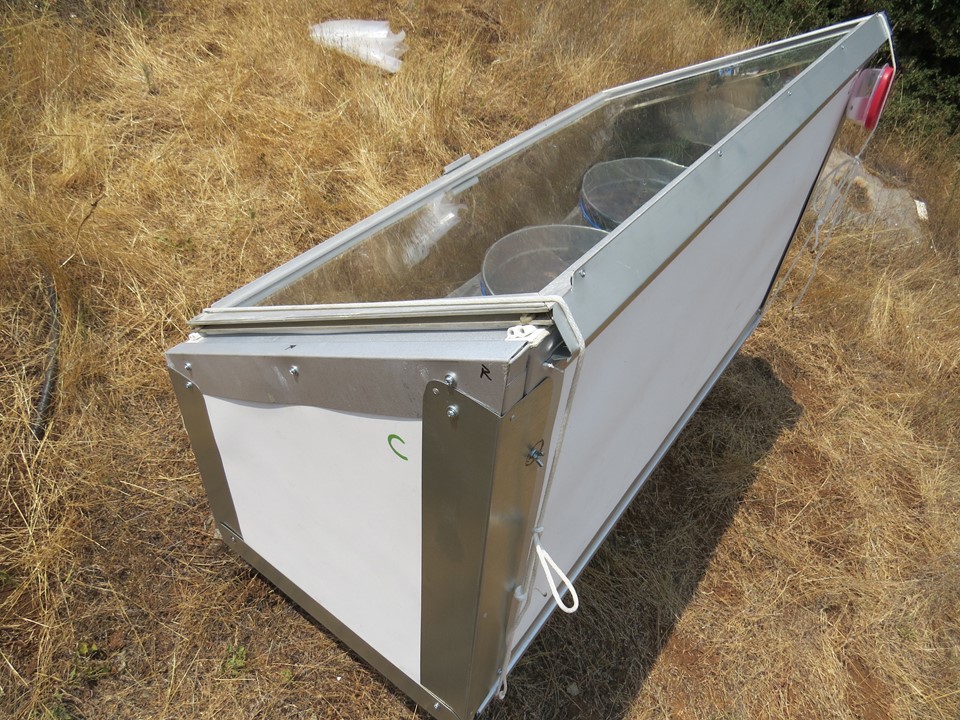 Figure 7. Back view solar oven, showing nylon cords holding window in place and temperature logger in plastic container wedged under cord on left side of the oven. The external probe is threaded through a crack and buried in the soil of the leftmost bucket
2. PERFORMANCE OF SOLAR OVENS
Three solar ovens (lettered A, B, and C) of the design described above were constructed in the summer of 2018 and deployed at a restoration site along a ridge near Morgan Hill, CA. They were used to heat-treat soil from P. cactorum-infested planting sites. For the summer 2018 installations, we decided to point the ovens more to the southwest than due south. The site is shaded in the morning by trees east of the plot, so we decided to try to extend the period of maximum light intensity later in the day. To do this, we aligned the ovens with the solar azimuth at 2 pm PDT, about one hour after solar noon. This angle changes over the summer, ranging from 223° on June 15 to 208° on August 15 at our site, based on NOAA Solar Calculator web site (https://www.esrl.noaa.gov/gmd/grad/solcalc).
2.1. Temperature measurements
Soil temperature data were recorded using either Inkbird THC-4 or Elitech RC-4 temperature loggers with external wire probes. All loggers were calibrated before use. Temperature data were recorded at 15 minute intervals. The temperature loggers were placed in plastic containers to protect them against moisture and were mounted on the outside of each oven on the back (north-facing) side (Figure 5). The external probe wire was threaded through a gap in the corner of the gasket used to seal the glass top. External temperature probes were placed in the likely coolest portion of the soil within the soil bucket. The temperature probe tip was centered midway between the bucket sidewall and the center chimney tube on the north (shaded) side of the bucket and inserted to about half the depth of the soil column in the bucket. The probe was placed in the bucket on the west end of the oven, which was assumed to be the coolest bucket because of partial shading by the west wall of the oven in late afternoon.
2.2. Temperature treatment targets
Minimum temperature X time targets for heat treatment at this site (Table 1) provided for a sizeable safety margin to allow for uncertainty in temperature readings and other factors. The temperature targets are tiered, with longer treatment times required for lower temperatures. If the soil reached at least 70 C for 1 hour (5 successive readings), only a single day of heat treatment was needed. For the lower temperatures (50 and 60 C), the temperature X time targets had to be attained on at least two days to provide large safety margins. If the maximum temperature did not exceed 60 C for at least 30 minutes (3 successive readings) on a given day, the temperature needed to exceed 50 C for at least seven successive readings to reach the target for that day.
Table 1. Minimum heating thresholds for solarization of soil in the solar oven based on duration of heating at three target temperatures. Temperatures are monitored using temperature loggers with external wired probes reading at 15-minute intervals. Probes were set into the coolest part of the soil in the ovens.
| Target temperature, C | Minimum number of days reaching temperature X time target | Minimum duration at or above temperature in a single day period | Minimum number of successive logger readings at or above target temperature in a single day period |
|---|---|---|---|
| 50 | 2 | 90 min | 7 |
| 60 | 2 | 30 min | 3 |
| 70 | 1 | 60 min | 5 |
2.3. Light intensity measurements
Light meters (Onset HOBO pendant temp/light sensor part UA-002-08) were used to measure and record light intensity. Meters were attached with plastic cable ties to a horizontal platform nailed on top of a wooden stake. Sensor height was about 30 cm above ground level and sensors were leveled to the degree possible. Sensors recorded light intensity in lumens/ft2 at 10 minute intervals.
2.4. Solar oven heating data
2.3.1. Initial deployment of solar oven A - 5/21-6/13/18
Soil temperature data for the initial deployment of solar oven A are shown in Figure 8 and Table 2. This initial run was terminated around noon on 6/13/18. Cloudy weather from 5/21 through 5/27 resulted in low soil temperatures in the oven over that period but soil temperatures attained target ranges on subsequent clear days (Figure 8 and Table 2). Figure 9 shows the effect of variable cloud cover on soil temperatures achieved in oven A on 2 successive days during this initial run. Although peak temperatures were reduced by cloudiness, substantial solar heating still occurred due to periods of high light intensity (Figure 9).
Soil in the solar oven showed strong diurnal temperature fluctuations (Figure 8). The daily soil temperature fluctuated over a much greater range in the ovens than in solarized sites at the same location. Compared with in situ solarized soil, excavated soil in the ovens reached both greater maximum and lower minimum temperatures in a given day. Heating of the center of the soil mass in the buckets lagged the maximum solar radiation level by about 4 hours (Figure 9, bottom). Although light intensity was greatest at 1 pm PDT (solar noon), soil temperature typically peaked around 5:15 pm and then gradually cooled to its lowest point by about 9:30 am the following day.
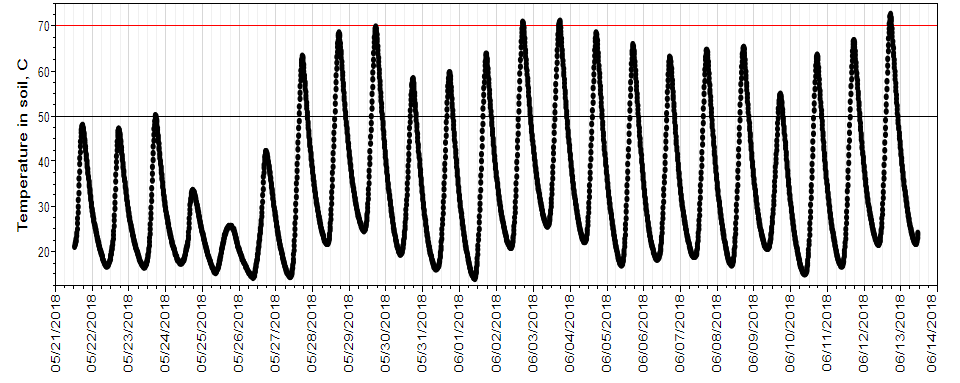 Figure 8. Soil heating over time for solar oven A after initial deployment 5/21/2018. Each major tick represents the start of the day shown. Weather was partly to mostly cloudy from 5/21 through 5/27. Temperature of soil in the buckets was recorded every 10 minutes.
The minimum heating standard of two days with at least 90 minutes over 50 C (Table 1) was attained on 5/28/18 (Table 2, Figure 6), after the first two mostly sunny days. The minimum time standard at 50 C for a given day (90 min) was greatly exceeded on each day from 5/27 through 6/12/18. The minimum daily time standard at 60 C (30 min) was also surpassed on 14 of these 17 days (Table 2). The single day 70 C heating standard (60 min) was attained on three of these days (Table 2).
Table 2. Minutes over 50, 60, and 70 C in soil in solar oven A in the initial run from 5/21 through 6/12/18. Skies were intermittently cloudy at the site from 5/21 through 5/26. Temperature of soil in the oven was recorded at 10 minute intervals.
| Date | Minutes over 50 C | Minutes over 60 C | Minutes over 70 C |
|---|---|---|---|
| 5/21/2018 | 0 | 0 | 0 |
| 5/22/2018 | 0 | 0 | 0 |
| 5/23/2018 | 30 | 0 | 0 |
| 5/24/2018 | 0 | 0 | 0 |
| 5/25/2018 | 0 | 0 | 0 |
| 5/26/2018 | 0 | 0 | 0 |
| 5/27/2018 | 330 | 120 | 0 |
| 5/28/2018 | 430 | 230 | 0 |
| 5/29/2018 | 430 | 240 | 0 |
| 5/30/2018 | 230 | 0 | 0 |
| 5/31/2018 | 250 | 0 | 0 |
| 6/1/2018 | 330 | 130 | 0 |
| 6/2/2018 | 460 | 270 | 60 |
| 6/3/2018 | 470 | 280 | 70 |
| 6/4/2018 | 380 | 210 | 0 |
| 6/5/2018 | 340 | 170 | 0 |
| 6/6/2018 | 310 | 120 | 0 |
| 6/7/2018 | 340 | 150 | 0 |
| 6/8/2018 | 350 | 160 | 0 |
| 6/9/2018 | 190 | 0 | 0 |
| 6/10/2018 | 300 | 130 | 0 |
| 6/11/2018 | 370 | 190 | 0 |
| 6/9/2018 | 470 | 280 | 100 |
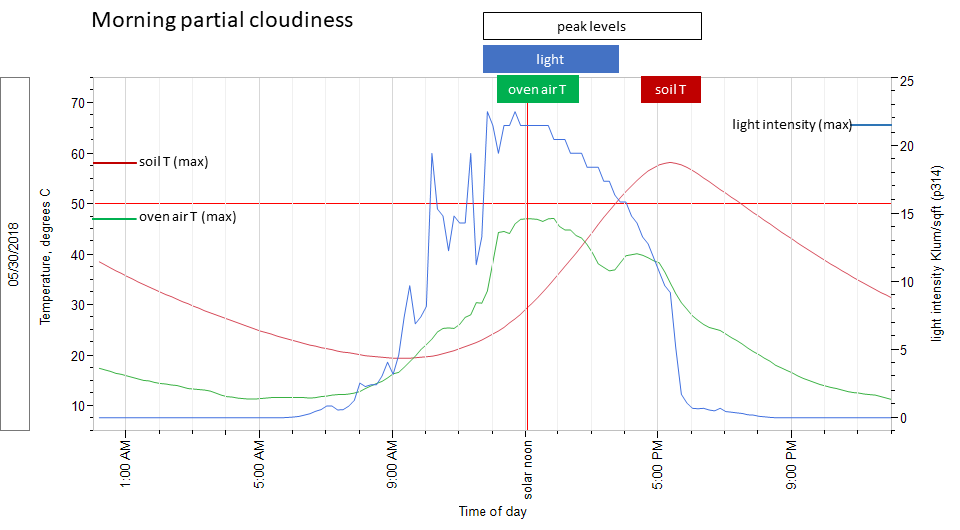
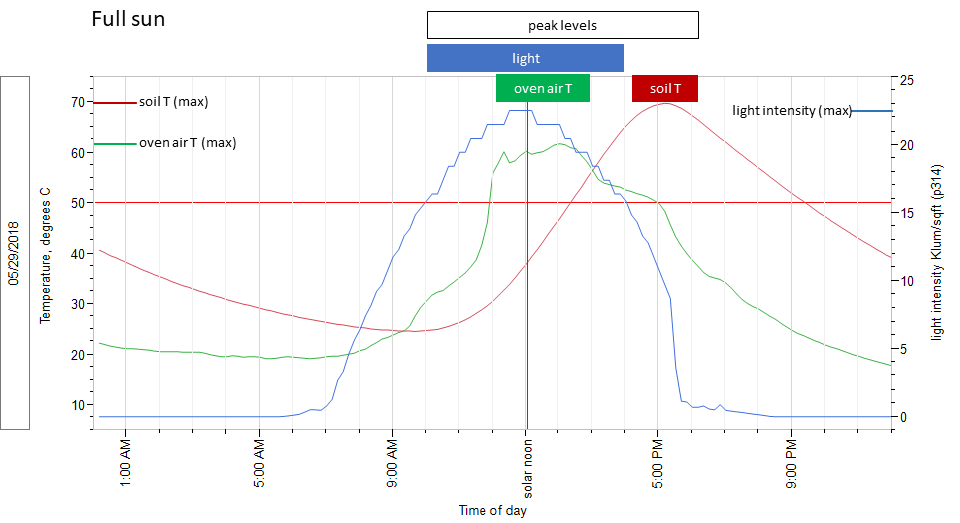 Figure 9. Relationship between light intensity and temperature attained in solar oven A on two successive days, one day with variable cloudiness (top graph) compared to a clear day (bottom graph). Each graph shows light intensity measurements (blue line) for a full sun site compared to soil temperature measured in solar oven A on the same day (red line) and oven air temperature (green line). Shown on left axis is temperature (°C) and light intensity (kilolumens/ft2). The maximum reading for soil (red) and oven air (green) temperature are shown by short horizontal lines on the left axis, the maximum reading for light intensity is shown on the right axis by a short horizontal red line. The red horizontal reference line across the graph is at 50°C. Spiking of the light intensity readings on the cloudy day (6/9/18) above levels seen on the clear day (5/29/18) is likely a sensor artifact associated with rapid changes in light intensity due to blowing clouds.
3.5.3. Performance of solar ovens A, B, and C - 7/2-8/1/18
Starting on 7/2/18, all three ovens were being used at the location. Ovens A and B were near each other in one site and oven C was set up at another site about 90 m away. All three solar ovens showed similar levels of heating in a given day (Figure 10). Maximum temperatures in oven C, which was in full sun and not exposed to late afternoon shading, were only slightly higher than those attained in ovens A and B, indicating that the late afternoon shading of those ovens had only a minor effect on heating. Because each heat treatment was conducted for a minimum of 3 days (soil changed twice per week), soil temperatures easily exceeded the established minimum thresholds for each batch of soil treated (Figures 11,12).
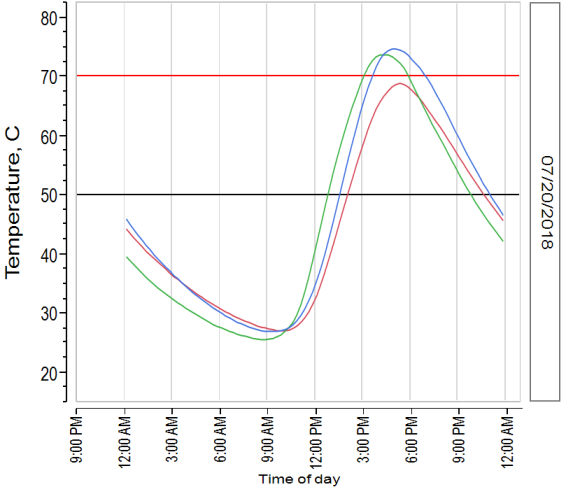 Figure 10. Soil temperature traces from temperature loggers in solar ovens in A (red), B (green) and C (blue) for 7/20/18. Ovens A and B become shaded in late afternoon, around 5 pm. Maximum soil temperature in the center of the soil mass was attained several hours after peak light intensity (solar noon, about 1 pm PDT).
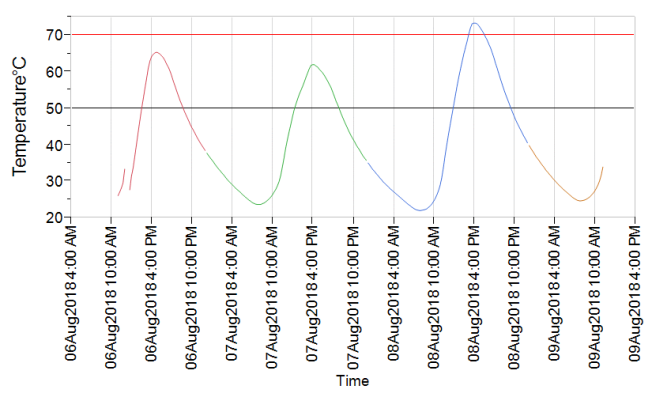 Figure 11. Temperature trace from solar oven C from 12:45 pm 8/6/18 through 11:15 am 8/9/18. In this typical 3-day treatment period, all three temperature X time treatment thresholds in Table 1 were exceeded. The color of line in the graph changes for each date. The break in line on 8/6/18 is due to the transfer of the logger probe between soil batches.
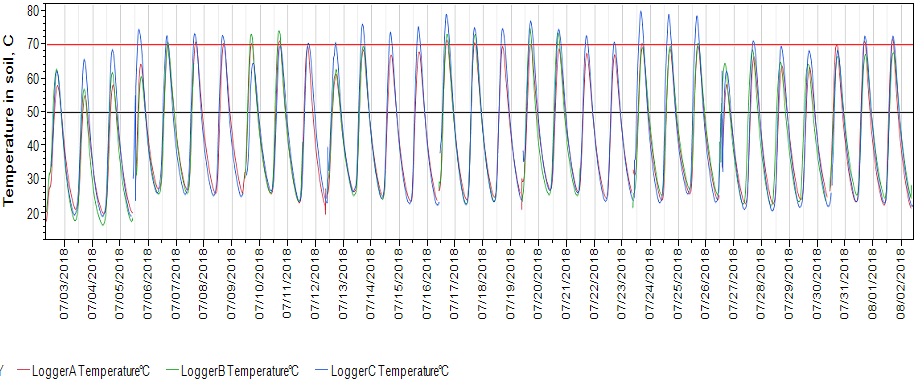 Figure 12. Soil heating in solar ovens A, B and C for 7/2 - 8/1/18. Top - Soil temperatures recorded with loggers every 15 minutes. New batches of soil were put into the ovens usually before midday (interruptions in the curves). Bottom - consecutive temperature readings ≥50 C for each treatment day. Solid horizontal line is the minimum number of readings needed to meet the 50 C threshold, which had to be attained on two days during each treatment interval. Vertical lines between dates indicate when soil batches were replaced. In both graphs, oven B temperatures for 7/7, 7/8, 7/11, 7/14, 7/15, 7/18, 7/21, and 7/22 were missing due to a logger reset problem.
3.5.4. Performance of solar ovens A, B, and C - 8/2-8/27/18
Ovens continued to perform well during August 2018. Temperature targets were easily exceeded throughout the month (Figure 13). Hazy skies occurred a number of days in August, due to wildfire smoke and haze. In particular, haze was noted on 8/7/18, and data showed a decline in solar heating compared to previous and succeeding days (Figure 13). Even with haze, temperatures were well in excess of the 50 C heating threshold (Table 1).
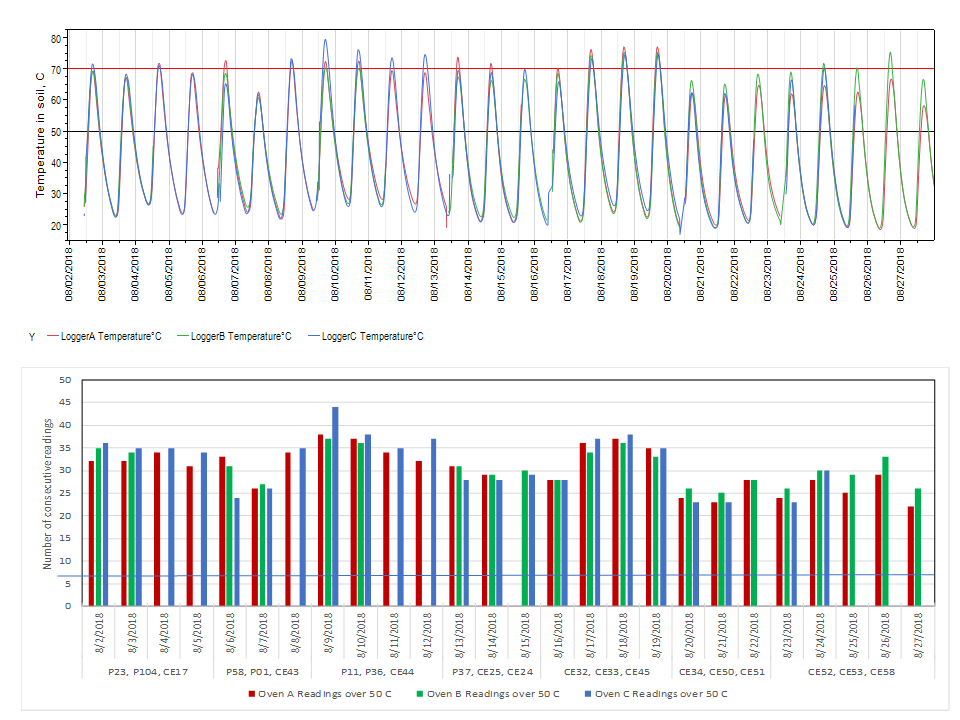 Figure 13. Soil heating in solar ovens A, B and C for 8/2 to 8/27/18. Starting 8/16/18, ovens A and B were placed next to oven C. Top - Soil temperatures recorded with loggers every 15 minutes. New batches of soil were put into the ovens usually before midday (interruptions in the curves). Bottom - consecutive temperature readings ≥50 C for each treatment day. Solid horizontal line is the minimum number of readings needed to meet the ≥50 C threshold, which had to be attained on two days during each treatment interval. In both graphs, some temperature data from ovens A (8/15), B (8/4, 8/5, 8/8, 8/11, 8/12), and C (8/22, 8/25-8/28) were missing due to logger reset problems.
3.5.5. Performance of solar ovens B and C, 8/27-9/13/18
Soil from the last two planting sites to be treated were placed in the ovens 8/27/18. They were not removed from the ovens until the morning of 9/14/18. Only one of the sensors was initialized properly and it logged soil temperature in oven B throughout this period (Figure 14). Temperatures remained well in excess of the minimums needed for soil heating even though solar angles, day length, and air temperatures were declining over this period. However, soil temperatures only reached 70 C twice during this period, much less frequently than seen earlier in the summer (Figure 14).
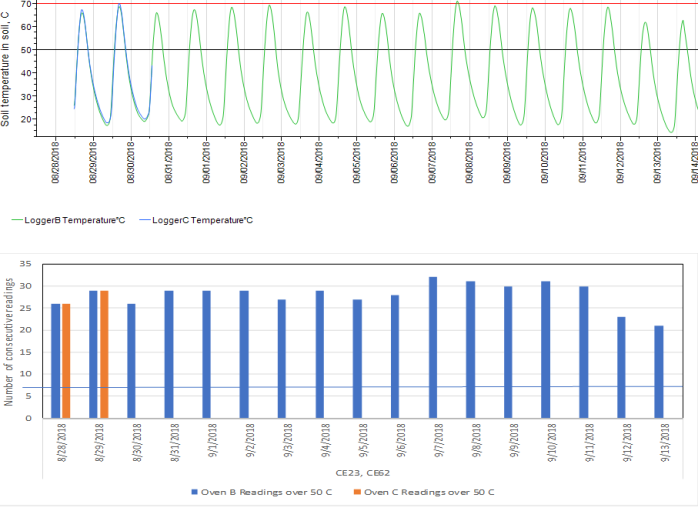 Figure 14. Soil heating in solar ovens B and C for 8/28 - 9/13/18. Top - Soil temperatures recorded with loggers every 15 minutes. Soil was not changed out over the entire recording interval. Bottom - consecutive temperature readings ≥50 C for each treatment day. Solid horizontal blue line is the minimum number of readings needed to meet the 50 C threshold, which had to be met on two days during each treatment interval. In both graphs, temperature data from oven C after 8/29 was missing due to a logger reset problem.
3. CONCLUSIONS
Treatment of soil from infested planting sites was successfully accomplished using portable solar ovens specifically designed for the task. Areas of full sun exposure during the period of maximum solar radiation were needed to use the ovens. Due to fluctuations in solar heating associated with clouds, haze, or smoke, it was necessary to monitor the actual soil temperatures attained in the solar ovens to ensure that minimum time X temperature targets were met. Performance of the ovens over summer 2018 was more than adequate for attaining the target heating levels, typically in as little as two days. Using the more conservative 3- to 4-day treatment period, it was possible to treat 6 sites per week with three ovens in use. In all, 59 planting sites were treated over summer 2018, mostly between 6/13 and 8/27/18. Our experience shows that heat treatment in solar ovens is a viable strategy to mitigate small, localized Phytophthora infestations, such as those that result from the planting of infected nursery stock. The technique is relatively labor intensive, primarily due to the need to carefully excavate each site, and typically requires at least two full days for each treatment.
Application to nurseries
These data also show the potential for using solar ovens in nurseries to heat treat soil, potting media, or containers, etc., to eliminate Phytophthora and other pathogens. In areas where access to solar radiation is adequate, an efficient solar oven is likely to provide adequate temperatures for heat treatment for much of the year, at least from the spring to autumnal equinoxes in much of California. Cloudy conditions may limit the number of days that produce adequate temperatures. Where it can be used, direct solar heating is clearly less expensive than using fuel or electricity. However, heat-treated media and containers may need to be treated in advance and stored for use during periods where solar heating may not be practical.
Various modifications to the design shown here would be appropriate because nursery conditions and needs are quite different from those that were considered in designing our ovens. In particular, adding wheels to the oven would allow it to be moved and rotated as needed to maximize solar energy input. The size and proportions of the oven can also be adjusted for the intended uses. If wind is not an issue, external reflectors that direct additional sunlight through the glass can be added to increase heating efficiency. Especially in larger ovens, heating uniformity may be increased by adding a small, heat-resistant internal fan (preferably solar powered) to circulate the air, such as occurs in a convection oven. The fan should only run during peak air temperatures in the oven (Figure 9). Once oven air temperatures drop below the temperature of the soil or other materials heated in the oven, air circulation will increase the rate of heat loss from the heated materials.
return to Phytosphere gear page