Effects of grazing on upland vegetation at Jepson Prairie Preserve, Solano County, CA
Third year (2007) results and final report
T. J. Swiecki and E. A. Bernhardt
Phytosphere Research, Vacaville CA
email: phytosphere@phytosphere.com
Download the full report (Adobe Acrobat PDF - 3.2 MB)
Additional key words: weed management, vegetation management, vernal pools, grazing impacts, microplot, native species
SUMMARY
The overall purpose of this study was to investigate how variations in the sheep grazing regime at Jepson Prairie Preserve affect vegetation. Weedy plant cover, especially exotic grass cover, predominates on the relatively high mound or upland areas of the Preserve, whereas native cover predominates in low lying areas. One goal of this study was to test whether the current sheep grazing regimes can be altered to increase cover of native plants in areas that are currently weed-dominated without adversely affecting areas that are currently dominated by native species. A second goal was to determine whether current grazing regimes used at Jepson Prairie Preserve are achieving conservation goals compared to a nongrazed condition. This final report presents results from the third year of this three-year study.
Eight plot locations with matched plots at adjacent mound/upland (high position) and pool/swale (low position) sites were established in each of three adjacent fields. Each field was grazed with a different prescribed grazing regime. For each plot location and topographic position (high or low), we established three plots: a grazed plot, a nongrazed multiyear control plot, and a nongrazed mowed control plot. Throughout the winter and spring, we assessed grazing impact to individual grazed plots by comparing vegetation height in adjacent grazed and nongrazed mowed control plots. A baseline assessment of native and exotic cover and species richness was conducted in the plots assigned to the grazed and nongrazed multiyear control treatments in late April 2004 prior to the exclusion of the control plots from grazing. Cover and species richness were reassessed again in April 2005, 2006, and 2007. Season-end vegetation height and residual dry matter (RDM) were assessed in August of 2004 through 2007.
Differential grazing impactsIn all three years of the study, adjacent high and low plots within fields were grazed at different intensities by sheep. In all years, sheep preferentially grazed the native-dominated low plots late in the season, when the exotic grasses began to dry out and set seed in the high plots. Weed-dominated high plots were grazed preferentially early in the winter when the low-lying native-dominated areas were flooded. However, if low positions plots were not flooded, sheep either preferentially grazed in low plots or grazing impacts in high and low plots were similar.
Variables describing grazing intensity and timing were related to the amount of August mulch and RDM in high and low position plots. Late season grazing was most closely correlated with reductions in RDM.
In high position grazed plots, none of the grazing variables tested were related to native or exotic species cover or richness. In low position grazed plots, grazing variables were related to native species cover but not to native species richness. Among low position grazed plots, increased grazing impact in the January-April grazing period was associated with less native cover in April. This trend was seen in all three years and was primarily associated with heavy grazing during the main spring bloom period. These results indicate that none of the grazing treatments tested were better than the pre-experiment grazing regimes with respect to increasing native cover or suppressing exotic cover.
Grazed versus nongrazed plots
In both high and low position plots, August RDM was significantly greater in all years in nongrazed plots than in grazed plots. In high plots, total exotic cover did not differ between nongrazed and grazed plots. However, when exotic cover in high plots was examined by plant guild, exotic forb cover was lower, and exotic grass cover was higher in nongrazed plots compared to grazed plots across the three years of the study. Medusahead (Taeniatherum caput-medusae) cover did not differ between grazed and nongrazed plots in either high or low positions.
Although exotic cover did not change in nongrazed high plots, native cover was significantly lower in nongrazed than in grazed high plots after three years of exclusion from grazing. After three years, the magnitude of the difference in native cover between high grazed (4.5% native cover) and nongrazed plots (1.5% native cover) was small. Most of the native cover in the high plots was saltgrass (Distichlis spicata).
In low position plots, native cover and the count of native species decreased significantly in nongrazed plots compared to grazed plots by the second year of exclusion from grazing. Cover of exotic species also increased significantly in nongrazed compared to grazed low plots by the second year. The primary component of exotic cover in low position nongrazed plots was exotic grasses, the most abundant of which was annual ryegrass (Lolium perenne ssp. multiflorum). The primary beneficial effect of sheep grazing in the low plots was the suppression of annual ryegrass. Exotic forb cover did not increase in nongrazed low plots.
Effects of environment
Over the three years of the study, vegetation growth was strongly affected by annual rainfall and temperature. Vegetation growth in 2006 was reduced relative to 2005 due to the late onset of winter rains and low temperatures in March. Vegetation growth and native cover were reduced in 2007 compared to the previous two years due to season-long reduced rainfall. Weather-related changes in vegetation outcomes associated with low rainfall were as large as or larger than the largest grazing-related vegetation changes. The decrease in native cover due to low rainfall in 2007 was equivalent to the effect of grazing cessation for three years, suggesting that on a year to year basis, weather has more potential to influence native cover than do most variations in grazing regimes.
Photo gallery - click on thumbnail to view larger image.
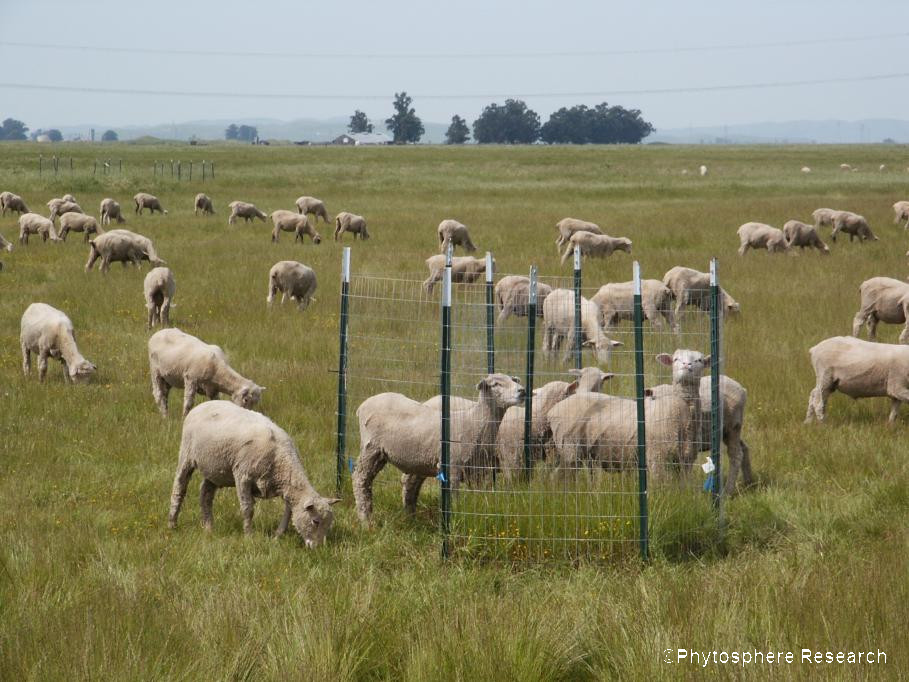
| Point sampling frame in foreground is over grazed high position plot. Two exclosed plots in background are low plots; the grazed low plot is to the left of the caged plots. (Apr 2007, Field 20E, cluster 14) | 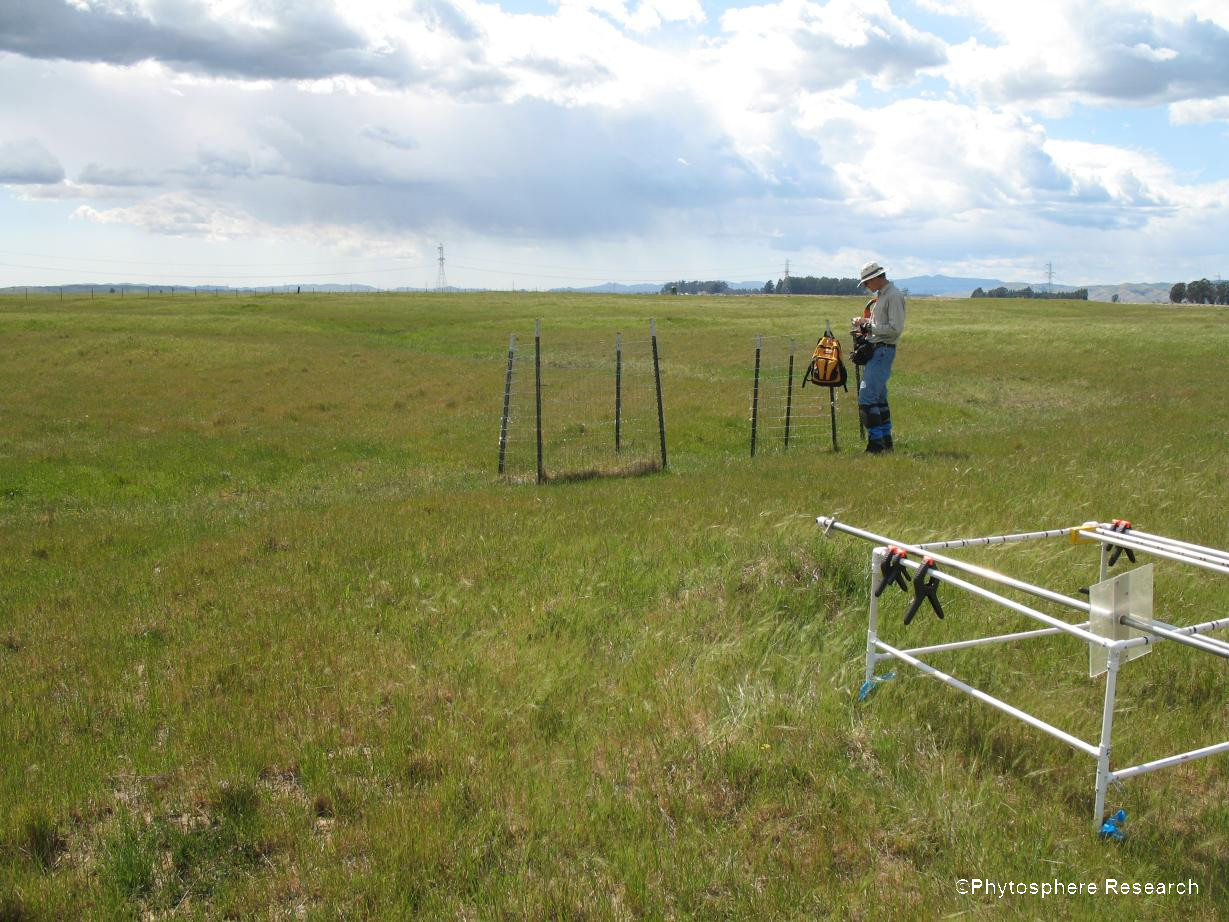 |
| Measuring vegetation height and water depth in exclosed plot prior to mowing (Feb 2005, Field 20E, cluster 11, low plots) | 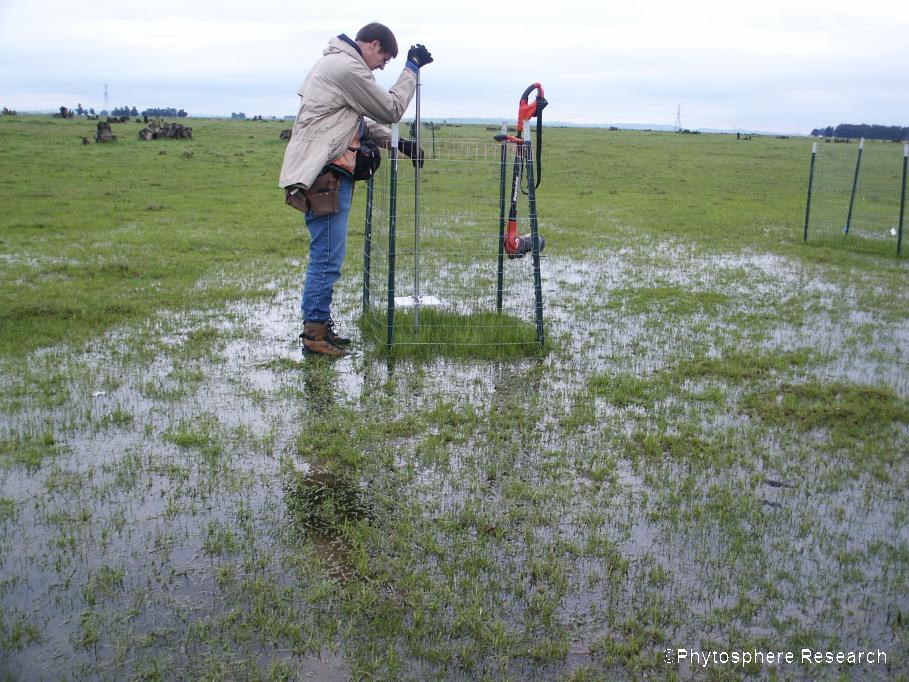 |
| Mowing vegetation in exclosed plot to adjust height to that of paired grazed plot (Feb 2005, Field 20E, cluster 11, low plots). | 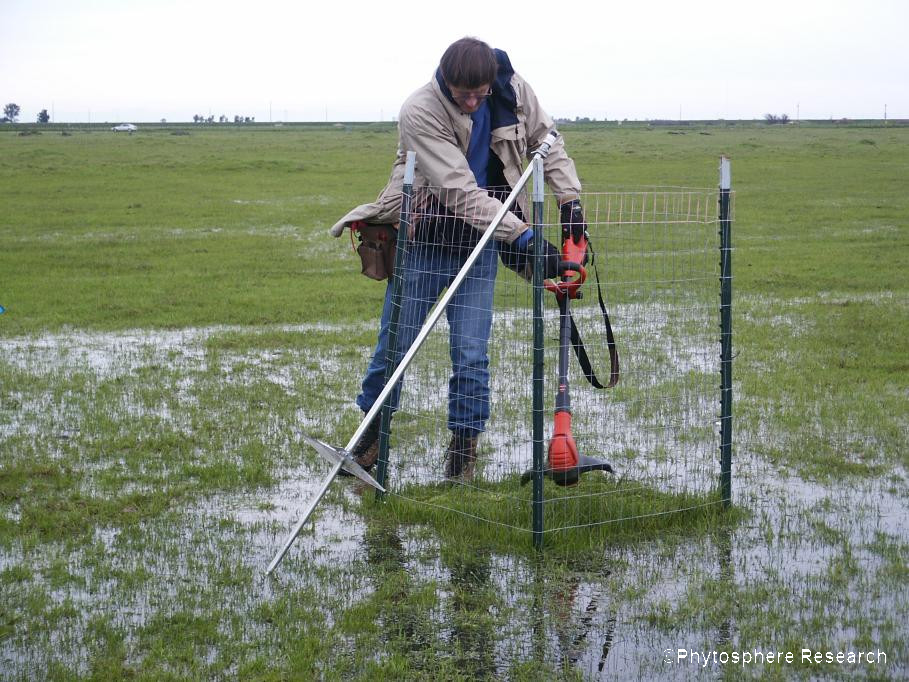 |
| Mowed exclosed plot (foreground) and grazed plots in low position at spring evaluation in April 2005 (Field 20E, cluster 11, low plots). | 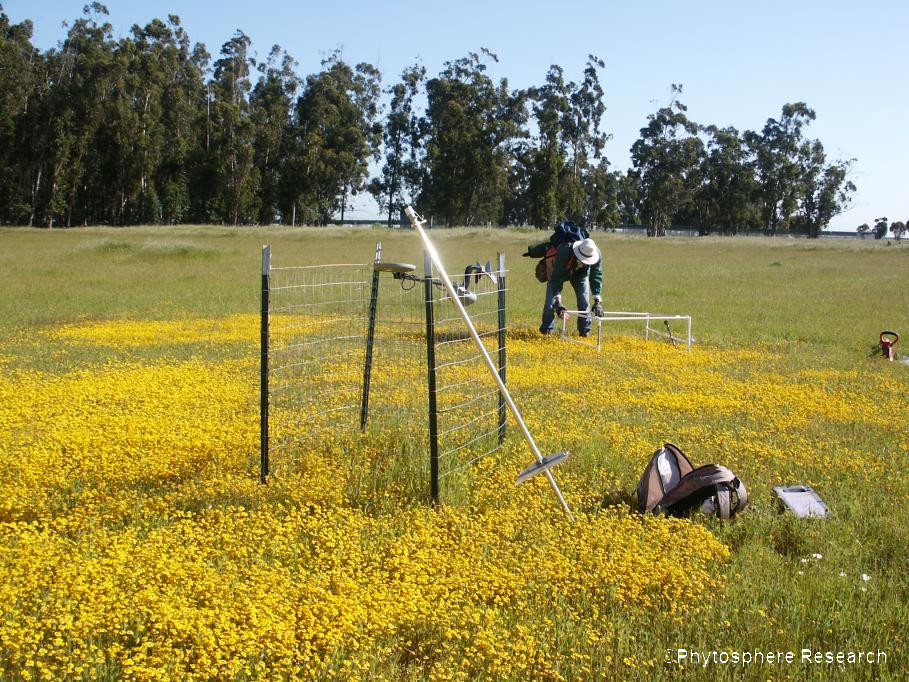 |
| Same low plots as above at spring evaluation in April 2007 following a dry winter. Exclosure at left is the long-term nongrazed control, right is mowed plot. Grazed plot is to right and behind the mowed plot (Field 20E, cluster 11, low plots). | 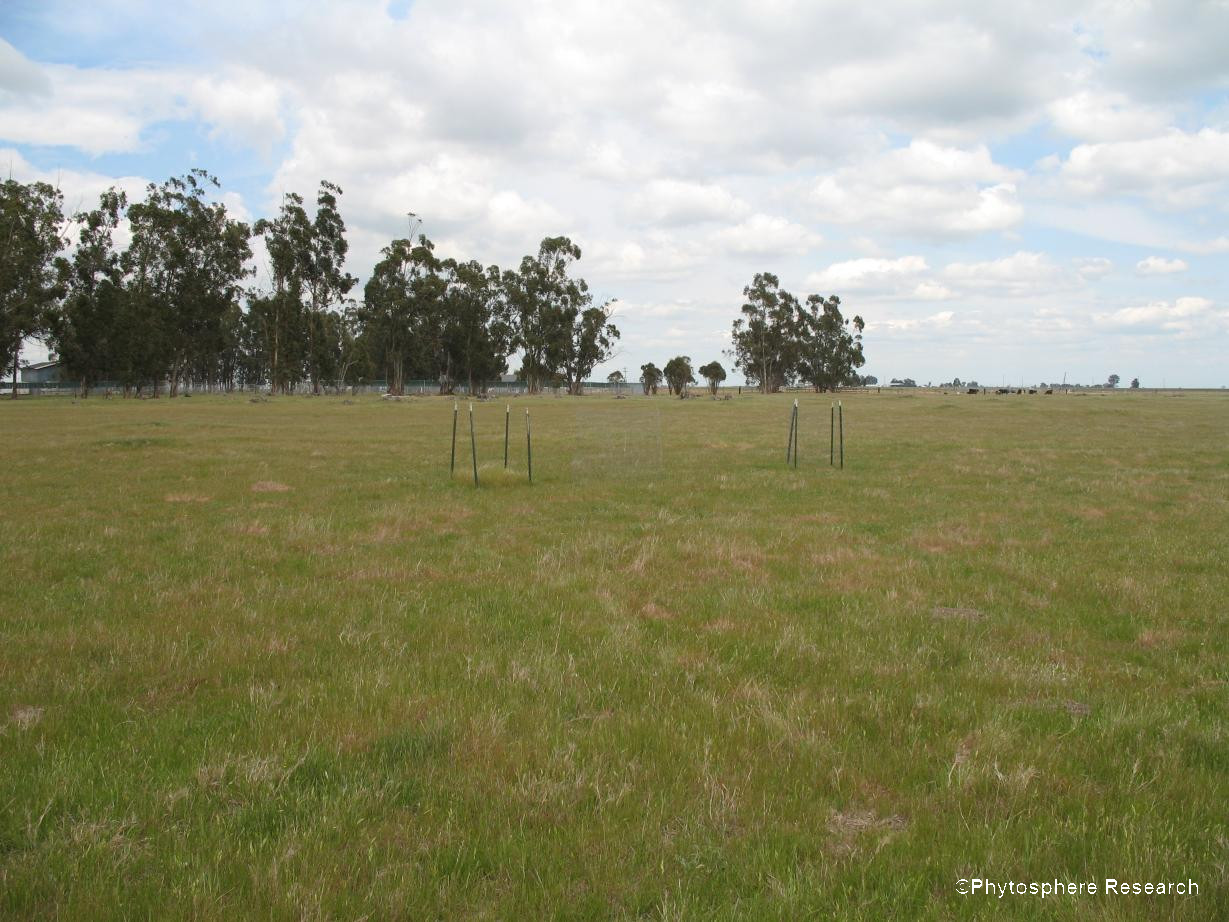 |
| Measuring vegetation height mowed low plot in in March 2005. Long term control is cage at center, grazed plot is frame at left. White flowers are meadowfoam (Limnanthes douglasii ssp. rosea ). Note that recent grazing has impacted the bloom of this species in the grazed plots relative to the exclosed plots in the first year of exclosure. High exclosed plots are visible in background. (Field 20E, cluster 11). | 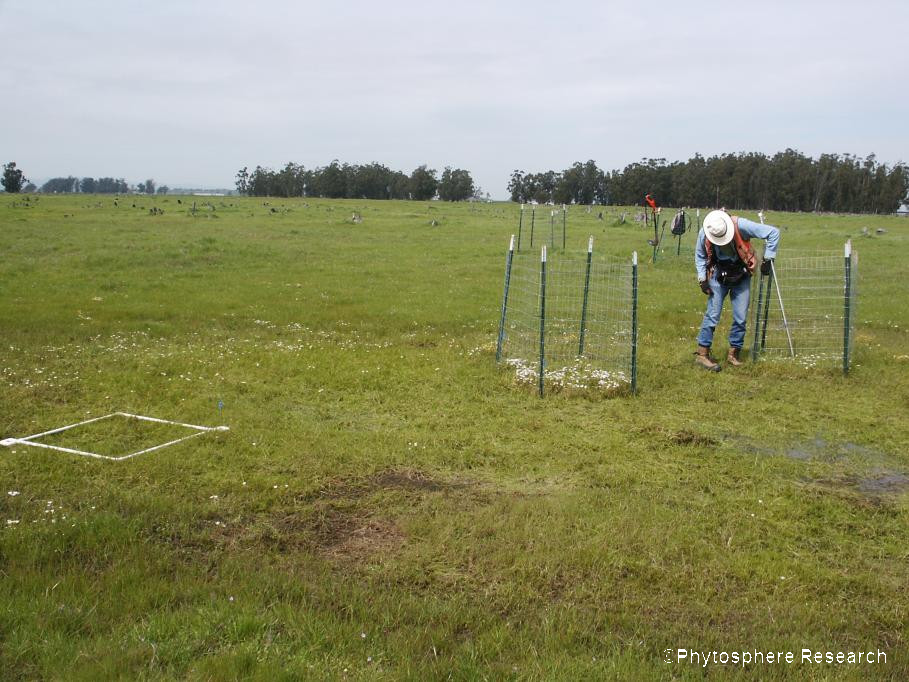 |
| Fence line view showing impact of heavy grazing during peak spring bloom (right - field 19E) compared to field not recently grazed (left - field 19W) in April 2005. | 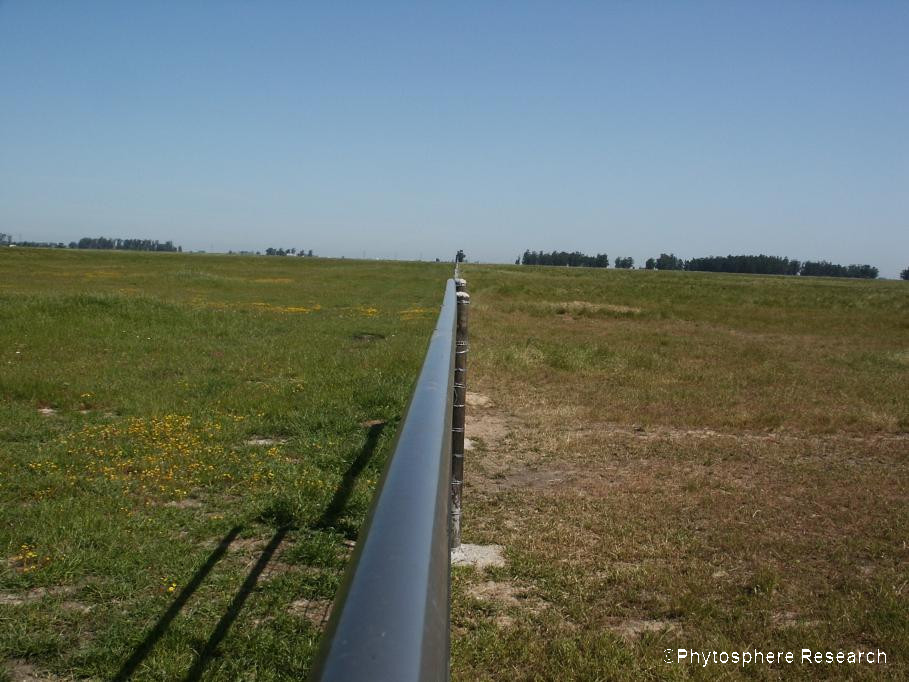 |
| From left to right - exclosed mowed, exclosed long term control, and grazed plot (with sampling frame) in April 2007. Note height of annual ryegrass in long-term control plot at center. (Field 19E, cluster 7, low plots). | 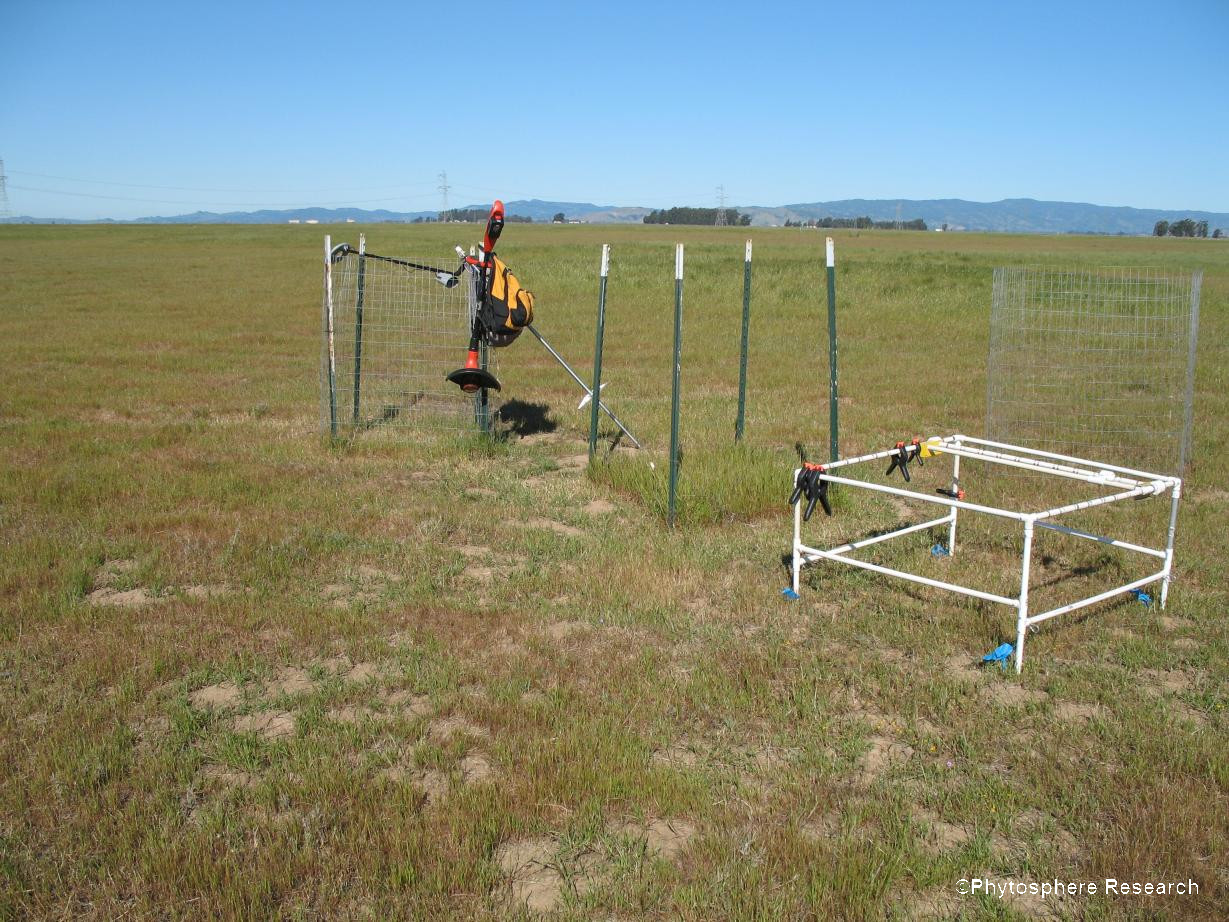 |
| Exclosed high plots in April 2006 (mowed to left, long term control at center), showing high vegetation growth compared to surrounding grazed area. Metal detector used to located grazed plot is at far right. (Field 19E, cluster 2) | 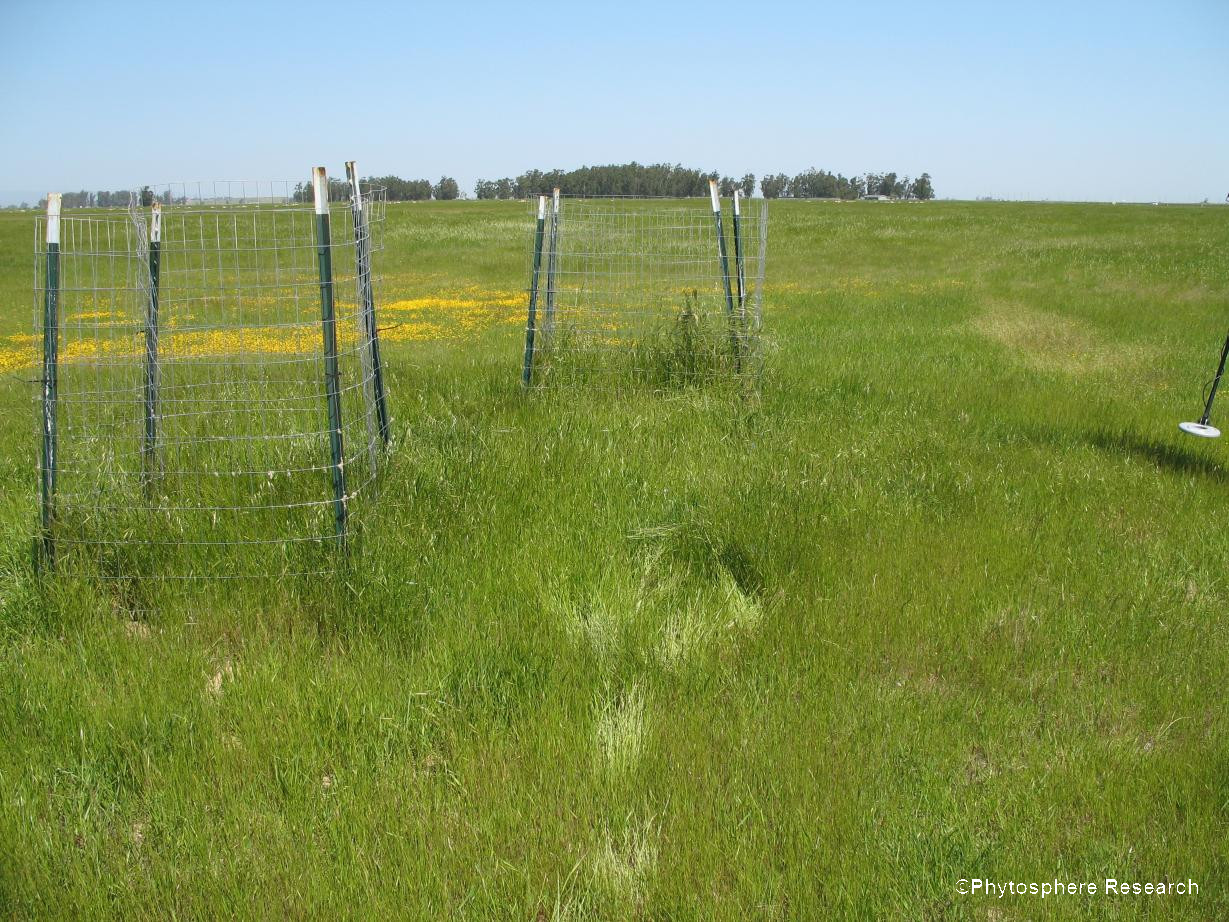 |